DC

Documentation: https://minipada.github.io/ros2_data_collection
Source code: https://github.com/minipada/ros2_data_collection
![]()
| Humble |
|---|
For detailed instructions:
- Setup
- Demos
- Concepts
- Data Pipeline
- Measurements
- Conditions
- Data validation
- Groups
- Destinations
- Configuration examples
- Infrastructure setup
- CLI tools
- Requirements
- Future work and Roadmap
- Contributing
- FAQ
- About and contact
Introduction
The DC (Data Collection) project aims at integrating data collection pipelines into ROS 2. The goal is to integrate data collection pipelines with existing APIs to enable data analytics, rather than live monitoring, which already has excellent tools available. As companies increasingly turn to autonomous robots, the ability to understand and improve operations for any type of machine in any environment has become crucial. This involves mostly pick and drop and inspection operations. This framework aims at helping collecting, validating (through JSON schemas) and sending reliably the data to create such APIs and dashboards.
DC uses a modular approach, based on pluginlib and greatly inspired by Nav2 for its architecture. Pluginlib is used to configure which measurements are collected and where the data goes. Measurements and destinations are pluginlib plugins. In addition to pluginlib, most plugins use Fluent Bit in the backend: Fluent Bit is a super fast, lightweight, and highly scalable logging and metrics processor and forwarder. It is the preferred choice for cloud and containerized environments. Developed and interfaced in C, it has already many features we directly can use, especially: high performance, reliability and data integrity (backpressure handling and data buffering in memory and filesystem).
Why collect data from robots?
- Performance Monitoring: Collecting data from a robot allows you to monitor its performance and identify areas for improvement. For example, you can use data to analyze the robot's motion and identify areas where it may be experiencing issues or inefficiencies.
- Fault Diagnosis: Data collection can also be used to diagnose faults and troubleshoot issues with the robot. By collecting data on various aspects of the robot's behavior, you can identify patterns or anomalies that may indicate problems with the system.
- Machine Learning: Data collected from robots can be used to train machine learning models, which can be used to improve the robot's performance and behavior. For example, you can use data collected from sensors to train models for object detection or path planning.
- Research and Development: Data collection is important for research and development in robotics. By collecting data on the behavior of robots in different scenarios, researchers can gain insights into how robots can be designed and optimized for different applications.
- Inventory Management: Data collection can be used to monitor inventory levels and track the movement of goods within a warehouse. This can help managers identify which products are in high demand and optimize the placement of products to improve order fulfillment times.
- Resource Allocation: Data collection can also help managers allocate resources more efficiently. For example, by monitoring the movement of people and goods within a warehouse, managers can identify bottlenecks and areas of congestion and adjust staffing and equipment allocation to address these issues.
- Process Improvement: Data collection can be used to monitor and analyze the performance of various processes within a warehouse. By identifying areas of inefficiency or errors, managers can develop strategies for improving these processes and increasing productivity.
- Predictive Maintenance: Data collection can be used to monitor the performance of equipment and identify potential maintenance issues before they occur. This can help managers schedule maintenance more effectively and avoid costly downtime due to equipment failure.
Main features
- Open source: Currently all tools on the market are not open source. This project is in MPL-2.0 license, in summary you can use without asking permission and without paying
- Modular approach: based on pluginlib and greatly inspired by Nav2 for its architecture
- Reliable data collection: validate and send data to create APIs and dashboards
- Flexible data collection: set polling interval for each measurement or collect every measurement with StringStamped messages
- Customizable validation: validate data using existing or customized JSON schemas
- Easy to extend: add new measurements or destinations by simply adding a plugin
- Flexible data collection conditions: collect data based on conditions such as whether the robot is moving or if a field is equal to a value
- Trigger-based data collection: collect data when a defined set of combination of all, any, or no condition are met
- Customizable record collection: configure the number of records to collect at the start and when a condition is activated.
- Data inspection: inspect data from camera input including barcode and QR codes
- Fast and efficient: high performance, using Fluent Bit for backend processing, and designed to minimize code duplication and reduce human errors
- Grouped measurements: measurements can be grouped using the group node based on the ApproximateTimeSynchronizer
- File saving: files can be saved, including map_server maps, camera images, and any file produced by a measurement
- Easy to use: designed to be easy to learn and use
- No C++ 3rd party library required: all 3rd party libraries have a vendor package in the repository
And inherited from Fluent Bit:
Here is an example of a pipeline:
flowchart LR
    pl_camera1["Camera bottom"]
    pl_camera2["Camera middle"]
    pl_camera3["Camera top"]
    pl_condition_moving["Moving"]
    pl_cpu["CPU"]
    pl_cmd_vel["Command velocity"]
    pl_memory["Memory"]
    pl_position["Position"]
    pl_speed["Speed"]
    pl_storage["Storage"]
    pl_uptime["Uptime"]
    pl_network["Network"]
    pl_network_boot["Network"]
    pl_os_boot["OS"]

    subgraph m_n["Measurement node"]
        subgraph cond["Condition plugins"]
            pl_condition_moving
        end
        subgraph measurements["Measurement plugins"]
            pl_camera1
            pl_camera2
            pl_camera3
            pl_cpu
            pl_cmd_vel
            pl_memory
            pl_position
            pl_speed
            pl_storage
            pl_uptime
            pl_network
            pl_network_boot
            pl_os_boot
        end
    end

    subgraph g_n["Group node"]
        gr_boot_system["System (boot)"]
        gr_system["System"]
        gr_robot["Robot"]
        gr_inspection["Inspection"]
    end

    subgraph d_n["Destination node"]
        pl_pgsql["PostgreSQL"]
        pl_minio["Minio"]
        pl_s3["S3"]
    end

    pl_camera1 -- if not --> pl_condition_moving --> gr_inspection
    pl_camera2 -- if not --> pl_condition_moving --> gr_inspection
    pl_camera3 -- if not --> pl_condition_moving --> gr_inspection
    pl_cpu --> gr_system
    pl_memory --> gr_system
    pl_uptime --> gr_boot_system
    pl_network_boot --> gr_boot_system
    pl_os_boot --> gr_boot_system
    pl_storage --> gr_system
    pl_cmd_vel --> gr_robot
    pl_position --> gr_robot
    pl_speed --> gr_robot

    pl_network -- Network ping and online status --> pl_pgsql
    gr_boot_system -- os, network interfaces\n, permissions and uptime --> pl_pgsql
    gr_robot -- Robot cmd_vel, position. speed --> pl_pgsql
    gr_system -- Available space,\n memory used and cpu usage --> pl_pgsql
    gr_inspection -- Image paths on s3 and minio --> pl_pgsql
    gr_inspection -- Raw, rotated and/or inspected images --> pl_minio
    gr_inspection -- Raw, rotated and/or inspected images --> pl_s3
License
This program is under the terms of the Mozilla Public License Version 2.0.
About and Contact
For any inquiry, please contact David (d.bensoussan@proton.me). If your inquiry relates to bugs or open-source feature requests, consider posting a ticket on our GitHub project. If your inquiry relates to configuration support or private feature development, reach out and we will be able to support you in your projects.
Setup
Use docker
Available images
Docker images with latest code are available on the Docker public registry:
| Image | Description |
|---|---|
| minipada/ros2_data_collection:humble-ci | ROS base image augmented with all DC dependencies to use for CI |
| minipada/ros2_data_collection:humble-ci-testing | CI image using the ROS testing repository |
| minipada/ros2_data_collection:humble-source | DC source compiled |
| minipada/ros2_data_collection:humble-source-sim | DC source compiled with all simulation packages |
| minipada/ros2_data_collection:humble-doc | Documentation |
Get any by running:
docker pull minipada/ros2_data_collection:<TAG>
Docker workflow
When developing, use the source-sim image with a docker compose file. The latest one is available on the repository:
version: "3.9"

services:
  ros2-data-collection:
    image: minipada/ros2_data_collection:humble-source-sim
    privileged: true
    container_name: ros2-data-collection
    environment:
      - QT_X11_NO_MITSHM=1
      - NVIDIA_VISIBLE_DEVICES=all
      - NVIDIA_DRIVER_CAPABILITIES=compute,utility,display
      - DISPLAY=unix$DISPLAY
      - XAUTHORITY=$XAUTHORITY
    volumes:
      - ${HOME}/.Xauthority:/root/.Xauthority
      - /tmp/.X11-unix:/tmp/.X11-unix
      - /var/run/docker.sock:/var/run/docker.sock
      - ${PWD}:/root/ws/src/ros2_data_collection
    network_mode: "host"
    restart: "unless-stopped"
    stop_grace_period: "3s"
    runtime: nvidia
    command: tail -F anything
    working_dir: /root/ws
Then, to allow GUI (RViz, Gazebo) to work in the container, execute:
xhost +
Then start the container:
docker compose up -d
And get in the container with:
docker exec -it ros2-data-collection /ros_entrypoint.sh bash
Build from source
Download the repository
Given that there is no apt packages available, you will need to build from source.
Download the repository in your workspace
git clone github.com/minipada/ros2_data_collection.git
Install dependencies
Install system and C/C++ dependencies
rosdep install --from-paths src --ignore-src -r -y
Some packages are external C++ packages but a vendor package has been included in the repository so colcon will handle it. In addition, since this set of packages has no python external dependencies, you won't need anything else.
Install python dependencies
This project uses poetry to manage python dependencies. It is easy to use and it is possible to set each package version like in a requirements.txt and manage multiple python environments. If you have poetry on your machine, you can execute:
poetry install
If not, you can install python dependencies from the provided requirements.txt:
pip3 install -r requirements.txt
Build
colcon build
Run
source install/setup.bash
ros2 launch dc_bringup bringup.launch.py
Issues
If you run into any issues when building ROS 2 Data Collection, you can use the search tool in the issues tab on GitHub and always feel free to open a ticket.
Demos
We will go together through some demos to get started with DC. You shall find them in the dc_demos package
Make sure you built and sourced the workspace.
Have you checked the configuration examples before running the demos? They will help understand how the demo configuration work.
| Title | Description |
|---|---|
| Uptime | Collect how long the system has been running and print it on Stdout. Minimal example |
| Group memory and uptime | Collect both memory and uptime and group them in a dictionary |
| Turtlebot3 Stdout | Collect command velocity, map, position and speed and print it in stdout |
| Turtlebot3 AWS Warehouse MinIO PostgreSQL | Collect system, robot, environment and infrastructure data and send it to MinIO and PostgreSQL |
| Turtlebot3 AWS Warehouse InfluxDB | Collect system, robot, environment and infrastructure data and send it to InfluxDB |
| Turtlebot3 QR codes | Collect QR codes and images |
| Custom plugin | Create an external plugin |
Note that each demo assumes concepts explained in previous demos will be acknowledged.
Uptime to stdout
This is the most minimal example to run DC, it collects the system uptime every 5 seconds and sends it to Stdout.
Let's run it:
ros2 launch dc_demos uptime_stdout.launch.py
At the end, the data is displayed:
[component_container_isolated-1] [{"date":1677668906.745817,"time":92395,"id":"be781e5ffb1e7ee4f817fe7b63e92c32","robot_name":"C3PO","run_id":"218"}]
[component_container_isolated-1] [{"date":1677668911.700309,"time":92400,"id":"be781e5ffb1e7ee4f817fe7b63e92c32","robot_name":"C3PO","run_id":"218"}]
[component_container_isolated-1] [{"date":1677668916.70031,"time":92405,"id":"be781e5ffb1e7ee4f817fe7b63e92c32","robot_name":"C3PO","run_id":"218"}]
[component_container_isolated-1] [{"date":1677668921.700388,"time":92410,"id":"be781e5ffb1e7ee4f817fe7b63e92c32","robot_name":"C3PO","run_id":"218"}]
[component_container_isolated-1] [{"date":1677668926.700422,"time":92415,"id":"be781e5ffb1e7ee4f817fe7b63e92c32","robot_name":"C3PO","run_id":"218"}]
This launchfile is a wrapper of dc_bringup/launch/bringup.launch.py which loads a custom yaml configuration
Configuration
Measurement
measurement_server:
  ros__parameters:
    measurement_plugins: ["uptime"]
    uptime:
      plugin: "dc_measurements/Uptime"
      topic_output: "/dc/measurement/uptime"
      polling_interval: 5000
      enable_validator: true
      debug: true
      tags: ["flb_stdout"]
      init_collect: true
    custom_str_params_list: ["robot_name", "id"]
    custom_str_params:
      robot_name:
        name: robot_name
        value: C3PO
      id:
        name: id
        value_from_file: /etc/machine-id
    run_id:
      enabled: true
      counter: true
      counter_path: "$HOME/run_id"
      uuid: false
measurement_plugins (Mandatory): List all the plugins to enable. This is a custom string that is equal to the measurement plugin dictionary present in the same level. If not listed, will not be loaded.
uptime.plugin (Mandatory): Name of the plugin, if you are not sure which plugin is available, use the CLI tool to list them
uptime.tags (Mandatory): This is used by Fluent Bit, to match inputs and outputs. More here
uptime.polling_interval (Optional): Interval to which data is collected in milliseconds
uptime.enable_validator (Optional): Will validate the data against a JSON schema. This file is located in the dc_measurements package. You can provide your own using the json_schema_path parameter, which we will explore later on
uptime.debug (Optional): More verbose output
uptime.init_collect (Optional): Collect when the node starts instead of waiting for the polling_interval time to pass
run_id.enabled (Optional): Identify which run the robot is. A new one is generated at every start of the node. Uses either a counter that increment at each restart of the node or UUID
run_id.counter (Optional): Enable counter for the run_id
run_id.counter_path (Optional): Path to store the last run. It is expanded with environment variables id
run_id.uuid (Optional): Generate a new run ID by using a random UUID
This will collect the uptime every 5 seconds (including when the node starts), will forward it to the flb_stdout destination.
Inject custom data for each record
Here, we want to append some content in every record: the robot name and its ID. While the robot name comes from a fixed variable in the parameter file, the id comes from the machine-id file.
custom_str_params_list (Optional): Look for those keys in this configuration to add them as keys and values in each record.
custom_str_params.robot_name (Optional): This parameter is loaded since it is mentioned in custom_str_params_list
custom_str_params.robot_name.name (Optional): Key in the dictionary to add
custom_str_params.robot_name.value (Optional): Value associated to the key in the dictionary to add
custom_str_params.id.name (Optional): Key in the dictionary to add
custom_str_params.id.value_from_file (Optional): Value associated to the key in the dictionary to add taken from the content of a file
Note that this configuration alone, sent to Fluent Bit will not display the JSON on stdout since it requires the destination_server configuration
Find the complete measurements documentation here
Destination
destination_server:
  ros__parameters:
    flb:
      flush: 1
      flb_grace: 1
      log_level: "info"
      storage_path: "/var/log/flb-storage/"
      storage_sync: "full"
      storage_checksum: "off"
      storage_backlog_mem_limit: "1M"
      scheduler_cap: 200
      scheduler_base: 5
      http_server: true
      http_listen: "0.0.0.0"
      http_port: 2020
      in_storage_type: "filesystem"
      in_storage_pause_on_chunks_overlimit: "off"
    destination_plugins: ["flb_stdout"]
    flb_stdout:
      plugin: "dc_destinations/FlbStdout"
      inputs: ["/dc/measurement/uptime"]
      time_format: "double"
      time_key: "date"
      debug: false
Destinations
Let's analyze piece by piece. First, we select the plugin to enable, create its section containing the plugin name and the topic to subscribe to. We need the topic list because in the background, the ROS 2 Fluent Bit plugin subscribes to each topic.
destination_plugins (Mandatory): List all the plugins to enable. This is a custom string that is equal to the destination plugin dictionary present in the same level. If not listed, will not be loaded.
flb_stdout.plugin (Mandatory): Plugin to load
flb_stdout.inputs (Mandatory): Topics to which to listen to get the data
flb_stdout.time_format (Optional): Format the data will be printed
flb_stdout.time_key (Optional): Dictionary key from which date will be taken from
flb_stdout.debug (Optional): Verbose output
Fluent Bit
Then, we configure Fluent Bit. This is not necessary but it is easy to do by using the ros parameters provided by the node.
flb.flush (Optional): Interval to flush output (seconds)
flb.flb_grace (Optional): Wait time (seconds) on exit
flb.log_level (Optional): Diagnostic level (error/warning/info/debug/trace)
flb.storage_path (Optional): Set an optional location in the file system to store streams and chunks of data. If this parameter is not set, Input plugins can only use in-memory buffering.
flb.storage_sync (Optional): Configure the synchronization mode used to store the data into the file system. It can take the values normal or full.
flb.storage_checksum (Optional): Enable the data integrity check when writing and reading data from the filesystem. The storage layer uses the CRC32 algorithm.
flb.storage_backlog_mem_limit (Optional): If storage.path is set, Fluent Bit will look for data chunks that were not delivered and are still in the storage layer, these are called backlog data. This option configure a hint of maximum value of memory to use when processing these records.
flb.scheduler_cap (Optional): Set a maximum retry time in seconds. The property is supported from v1.8.7.
flb.scheduler_base (Optional): Set a base of exponential backoff. The property is supported from v1.8.7.
flb.http_server (Optional): If true enable statistics HTTP server
flb.http_listen (Optional): Address to listen (e.g. 0.0.0.0)
flb.http_port (Optional): Port to listen (e.g. 8888)
flb.in_storage_type (Optional): Specifies the buffering mechanism to use. It can be memory or filesystem.
flb.in_storage_pause_on_chunks_overlimit (Optional): Specifies if file storage is to be paused when reaching the chunk limit.
Inject run id at each record
Finally, we set the run id. This is used later on when fetching data for a run. It can come from a counter which is incremented at each start of the node or from a random UUID generated. The counter mechanism writes and read on a file on the system (take care of not deleting it), you can set its path as a parameter.
Find the complete destinations documentation here
Console output
Now that the node started, let us see what's displayed in the console
[component_container_isolated-1] [INFO] [1677668906.621492168] [dc_container]: Load Library: /root/ws/install/dc_measurements/lib/libmeasurement_server_core.so
[component_container_isolated-1] [INFO] [1677668906.634130562] [dc_container]: Found class: rclcpp_components::NodeFactoryTemplate<measurement_server::MeasurementServer>
[component_container_isolated-1] [INFO] [1677668906.634246977] [dc_container]: Instantiate class: rclcpp_components::NodeFactoryTemplate<measurement_server::MeasurementServer>
[component_container_isolated-1] [INFO] [1677668906.655803692] [measurement_server]:
	measurement_server lifecycle node launched.
	Waiting on external lifecycle transitions to activate
	See https://design.ros2.org/articles/node_lifecycle.html for more information.
[component_container_isolated-1] [INFO] [1677668906.670233932] [dc_container]: Load Library: /root/ws/install/dc_destinations/lib/libdestination_server_core.so
[component_container_isolated-1] [INFO] [1677668906.675826543] [dc_container]: Found class: rclcpp_components::NodeFactoryTemplate<destination_server::DestinationServer>
[component_container_isolated-1] [INFO] [1677668906.675864319] [dc_container]: Instantiate class: rclcpp_components::NodeFactoryTemplate<destination_server::DestinationServer>
[component_container_isolated-1] [INFO] [1677668906.680499515] [destination_server]:
[component_container_isolated-1] 	destination_server lifecycle node launched.
[component_container_isolated-1] 	Waiting on external lifecycle transitions to activate
[component_container_isolated-1] 	See https://design.ros2.org/articles/node_lifecycle.html for more information.
[INFO] [launch_ros.actions.load_composable_nodes]: Loaded node '/destination_server' in container 'dc_container'
[component_container_isolated-1] [INFO] [1677668906.684802172] [dc_container]: Load Library: /opt/ros/humble/lib/libnav2_lifecycle_manager_core.so
[component_container_isolated-1] [INFO] [1677668906.685487672] [dc_container]: Found class: rclcpp_components::NodeFactoryTemplate<nav2_lifecycle_manager::LifecycleManager>
[component_container_isolated-1] [INFO] [1677668906.685510016] [dc_container]: Instantiate class: rclcpp_components::NodeFactoryTemplate<nav2_lifecycle_manager::LifecycleManager>
[component_container_isolated-1] [INFO] [1677668906.691075881] [lifecycle_manager_navigation]: Creating
[INFO] [launch_ros.actions.load_composable_nodes]: Loaded node '/lifecycle_manager_navigation' in container 'dc_container'
[component_container_isolated-1] [INFO] [1677668906.692954854] [lifecycle_manager_navigation]: Creating and initializing lifecycle service clients
[component_container_isolated-1] [INFO] [1677668906.695025050] [lifecycle_manager_navigation]: Starting managed nodes bringup...
Measurement server and destination server are starting in the Lifecycle, you can read more about it here
Afterward, the measurement_server starts:
[component_container_isolated-1] [INFO] [1677668906.695056624] [lifecycle_manager_navigation]: Configuring measurement_server
[component_container_isolated-1] [INFO] [1677668906.695181755] [measurement_server]: Configuring
[component_container_isolated-1] [INFO] [1677668906.698019687] [measurement_server]: Creating measurement plugin uptime: Type dc_measurements/Uptime, Group key: uptime, Polling interval: 5000, Debug: 1, Validator enabled: 1, Schema path: , Tags: [flb_stdout], Init collect: 1, Init Max measurement: 0, Include measurement name: 0, Include measurement plugin name: 0, Remote keys: , Remote prefixes: , Include measurement plugin name: 0, Max measurement on condition: 0, If all condition: , If any condition: , If none condition:
[component_container_isolated-1] [INFO] [1677668906.698932685] [measurement_server]: Configuring uptime
[component_container_isolated-1] [INFO] [1677668906.699937310] [measurement_server]: Done configuring uptime
[component_container_isolated-1] [INFO] [1677668906.700162355] [measurement_server]: Looking for schema at /root/ws/install/dc_measurements/share/dc_measurements/plugins/measurements/json/uptime.json
[component_container_isolated-1] [INFO] [1677668906.700192161] [measurement_server]: schema: {"$schema":"http://json-schema.org/draft-07/schema#","description":"Time the system has been up","properties":{"time":{"description":"Time the system has been up","minimum":0,"type":"integer"}},"title":"Uptime","type":"object"}
Plugins are loaded one by one (here only one is, the uptime one) and configured. The configuration for each is displayed and the validation schema is also loaded and its path printed.
Then, the destination_server starts:
[component_container_isolated-1] [INFO] [1677668906.700528260] [lifecycle_manager_navigation]: Configuring destination_server
[component_container_isolated-1] [INFO] [1677668906.700620104] [destination_server]: Configuring
[component_container_isolated-1] [INFO] [1677668906.701246047] [destination_server]: Fluent Bit service initialized
[component_container_isolated-1] [INFO] [1677668906.701470896] [destination_server]: Creating destination plugin flb_stdout: Type dc_destinations/FlbStdout, Debug: 0, Time format: double. Time key: date
[component_container_isolated-1] [INFO] [1677668906.702670279] [destination_server]: Configuring Flb plugin flb_stdout
[component_container_isolated-1] [INFO] [1677668906.702871127] [destination_server]: Loaded lua filter. Match=ros2, code=function concatenate(tag, timestamp, record) if (type(record["tags"]) == "table") then record["tags"] = table.concat(record["tags"], ",") end  return 2, timestamp, record end
[component_container_isolated-1] [INFO] [1677668906.702912686] [destination_server]: Loaded rewrite_tag filter. Match=ros2, Rule=$tags .*(flb_stdout).* flb_stdout true
[component_container_isolated-1] [INFO] [1677668906.703021628] [destination_server]: Done configuring Flb plugin flb_stdout
[component_container_isolated-1] [INFO] [1677668906.703049312] [destination_server]: Loading input ros2 shared library /root/ws/install/fluent_bit_plugins/lib/flb-in_ros2.so...
[component_container_isolated-1] [INFO] [1677668906.703818806] [destination_server]: Loaded input ros2 shared library /root/ws/install/fluent_bit_plugins/lib/flb-in_ros2.so
[component_container_isolated-1] [INFO] [1677668906.703899346] [destination_server]: Flb ros2 plugin initialized. ret=0
[component_container_isolated-1] [INFO] [1677668906.703908977] [destination_server]: Starting Flb engine...
[component_container_isolated-1] [2023/03/01 11:08:26] [ info] [fluent bit] version=2.0.7, commit=1ab360f79c, pid=31126
[component_container_isolated-1] [2023/03/01 11:08:26] [ info] [storage] ver=1.3.0, type=memory+filesystem, sync=full, checksum=off, max_chunks_up=128
[component_container_isolated-1] [2023/03/01 11:08:26] [ info] [storage] backlog input plugin: storage_backlog.1
[component_container_isolated-1] [2023/03/01 11:08:26] [ info] [cmetrics] version=0.5.7
[component_container_isolated-1] [2023/03/01 11:08:26] [ info] [ctraces ] version=0.2.5
[component_container_isolated-1] [2023/03/01 11:08:26] [ info] [input:ros2:ros2.0] initializing
[component_container_isolated-1] [2023/03/01 11:08:26] [ info] [input:ros2:ros2.0] storage_strategy='filesystem' (memory + filesystem)
[component_container_isolated-1] [2023/03/01 11:08:26] [ info] Started node fluentbit_rclc
[component_container_isolated-1] [2023/03/01 11:08:26] [ info] Created subscriber /dc/measurement/uptime
[component_container_isolated-1] [2023/03/01 11:08:26] [ info] [input:storage_backlog:storage_backlog.1] initializing
[component_container_isolated-1] [2023/03/01 11:08:26] [ info] [input:storage_backlog:storage_backlog.1] storage_strategy='memory' (memory only)
[component_container_isolated-1] [2023/03/01 11:08:26] [ info] [input:storage_backlog:storage_backlog.1] queue memory limit: 976.6K
[component_container_isolated-1] [2023/03/01 11:08:26] [ info] [input:emitter:emitter_for_rewrite_tag.2] initializing
[component_container_isolated-1] [2023/03/01 11:08:26] [ info] [input:emitter:emitter_for_rewrite_tag.2] storage_strategy='filesystem' (memory + filesystem)
[component_container_isolated-1] [2023/03/01 11:08:26] [ info] [output:stdout:stdout.0] worker #0 started
[component_container_isolated-1] [2023/03/01 11:08:26] [ info] [http_server] listen iface=0.0.0.0 tcp_port=2020
[component_container_isolated-1] [2023/03/01 11:08:26] [ info] [sp] stream processor started
[component_container_isolated-1] [INFO] [1677668906.744577163] [destination_server]: Started Flb engine
It starts the FlbStdout destination plugin, filters used internally by Fluent to edit Timestamps and tags. It then loads the ROS 2 Fluent Bit shared library and initialize it with the topics we provided as parameter.
Afterward, Fluent Bit starts, it prints its version, storage strategy and buffer configuration and lists which plugins are loaded.
Then, the measurement and destination server nodes are activated:
[component_container_isolated-1] [INFO] [1677668906.745180268] [lifecycle_manager_navigation]: Activating measurement_server
[component_container_isolated-1] [INFO] [1677668906.745462265] [measurement_server]: Activating
[component_container_isolated-1] [INFO] [1677668906.745558665] [measurement_server]: Activating uptime
[component_container_isolated-1] [INFO] [1677668906.746014639] [measurement_server]: Creating bond (measurement_server) to lifecycle manager.
[component_container_isolated-1] [INFO] [1677668906.853199899] [lifecycle_manager_navigation]: Server measurement_server connected with bond.
[component_container_isolated-1] [INFO] [1677668906.853316226] [lifecycle_manager_navigation]: Activating destination_server
[component_container_isolated-1] [INFO] [1677668906.853620571] [destination_server]: Activating
[component_container_isolated-1] [INFO] [1677668906.853722659] [destination_server]: Activating flb_stdout
[component_container_isolated-1] [INFO] [1677668906.853796078] [destination_server]: Creating bond (destination_server) to lifecycle manager.
[component_container_isolated-1] [INFO] [1677668906.961666207] [lifecycle_manager_navigation]: Server destination_server connected with bond.
[component_container_isolated-1] [INFO] [1677668906.961777773] [lifecycle_manager_navigation]: Managed nodes are active
[component_container_isolated-1] [INFO] [1677668906.961820078] [lifecycle_manager_navigation]: Creating bond timer...
Finally, we see the data:
[component_container_isolated-1] [{"date":1677668906.745817,"time":92395,"id":"be781e5ffb1e7ee4f817fe7b63e92c32","robot_name":"C3PO","run_id":"218"}]
[component_container_isolated-1] [{"date":1677668911.700309,"time":92400,"id":"be781e5ffb1e7ee4f817fe7b63e92c32","robot_name":"C3PO","run_id":"218"}]
[component_container_isolated-1] [{"date":1677668916.70031,"time":92405,"id":"be781e5ffb1e7ee4f817fe7b63e92c32","robot_name":"C3PO","run_id":"218"}]
[component_container_isolated-1] [{"date":1677668921.700388,"time":92410,"id":"be781e5ffb1e7ee4f817fe7b63e92c32","robot_name":"C3PO","run_id":"218"}]
[component_container_isolated-1] [{"date":1677668926.700422,"time":92415,"id":"be781e5ffb1e7ee4f817fe7b63e92c32","robot_name":"C3PO","run_id":"218"}]
So...what happened?
- The measurement plugin starts publishing data to /dc/measurement/uptime, which contains the JSON, tags and timestamp of the message
- Run ID and robot_name is appended in the JSON
- The ROS 2 Fluent Bit plugin, which subscribes to this topic, receive the data and pass it on to Fluent Bit
- Fluent Bit receives it, applies the timestamp filter (which modifies the timestamp to the desired format)
- Fluent Bit applies changes the tag with another filter. This tag is used to match to the destination afterward.
- Data is flushed
- The Fluent Bit stdout output plugin receives the data because tags match (the flb_stdout tag is used) and forwards it to Stdout
Group memory and uptime
This demo will introduce the group node. It subscribes to multiple nodes and group for each its data and republishes on a new topic.
Let's run it:
ros2 launch dc_demos group_memory_uptime_stdout.launch.py
[component_container_isolated-1] [{"memory":{"used":71.67569732666016},"date":1677673405.921659,"uptime":{"time":96894},"run_id":"221"}]
[component_container_isolated-1] [{"memory":{"used":71.70790100097656},"date":1677673408.868847,"uptime":{"time":96897},"run_id":"221"}]
[component_container_isolated-1] [{"memory":{"used":71.72582244873047},"date":1677673411.869299,"uptime":{"time":96900},"run_id":"221"}]
[component_container_isolated-1] [{"memory":{"used":71.86643218994141},"date":1677673414.869292,"uptime":{"time":96903},"run_id":"221"}]
[component_container_isolated-1] [{"memory":{"used":71.82553863525391},"date":1677673417.869207,"uptime":{"time":96906},"run_id":"221"}]
This launchfile is a wrapper of dc_bringup/launch/bringup.launch.py which loads a custom yaml configuration
Note that here the group node is started. It is one parameter in the launchfile to enable it. In the uptime demo, it is disabled by default because it is not used.
Configuration
Measurement
We collect data from 2 plugins: memory and uptime. The first every second and the latter every 3.
measurement_server:
  ros__parameters:
    measurement_plugins: ["memory", "uptime"]
    memory:
      plugin: "dc_measurements/Memory"
      group_key: "memory"
      topic_output: "/dc/measurement/memory"
      polling_interval: 1000
    uptime:
      plugin: "dc_measurements/Uptime"
      group_key: "uptime"
      topic_output: "/dc/measurement/uptime"
      polling_interval: 3000
Data is now published on 2 ROS topics: /dc/measurement/uptime and /dc/measurement/memory.
The group_key mentioned will be used by the group node to assign a key in the new dictionary
Group
This create a memory_uptime group, subscribes to /dc/measurement/memory and /dc/measurement/uptime topics and republish the result on /dc/group/memory_uptime. The sync_delay allows to wait in a 5 seconds window timeframe the data from each topic before throwing away the data if one topic does not publish it
group_server:
  ros__parameters:
    groups: ["memory_uptime"]
    memory_uptime:
      inputs: ["/dc/measurement/memory", "/dc/measurement/uptime"]
      output: "/dc/group/memory_uptime"
      sync_delay: 5.0
      group_key: "memory_uptime"
      tags: ["flb_stdout"]
      include_group_name: false
include_group_name (Optional): Will include the name of the group in the JSON, it makes it easier later on to fetch the data from your API. In this case, we can skip it since we only have one group to show.
You can also notice that the group also has a "group_key". It means a group can be part of another.
Destination
Here, we only subscribe to the /dc/group/memory_uptime topic
    flb_stdout:
      plugin: "dc_destinations/FlbStdout"
      inputs: ["/dc/group/memory_uptime"]
Console output
In the terminal, you can see the result, published every 3 seconds (see the date field), which the is timeframe defined by sync_delay and the maximum polling_interval of the measurements.
Finally, note the new dictionary uses the key defined in the group_key measurement_server plugin configuration. They are transferred through the ROS message.
[component_container_isolated-1] [{"memory":{"used":71.67569732666016},"date":1677673405.921659,"uptime":{"time":96894},"run_id":"221"}]
[component_container_isolated-1] [{"memory":{"used":71.70790100097656},"date":1677673408.868847,"uptime":{"time":96897},"run_id":"221"}]
[component_container_isolated-1] [{"memory":{"used":71.72582244873047},"date":1677673411.869299,"uptime":{"time":96900},"run_id":"221"}]
[component_container_isolated-1] [{"memory":{"used":71.86643218994141},"date":1677673414.869292,"uptime":{"time":96903},"run_id":"221"}]
[component_container_isolated-1] [{"memory":{"used":71.82553863525391},"date":1677673417.869207,"uptime":{"time":96906},"run_id":"221"}]
Turtlebot3
In this example, we add a robot and start collecting robot data to Stdout.
You will also need 2 terminal windows, to:
- Run the Nav2 turtlebot3 launchfile: it starts localization, navigation and RViz
- Run DC
Since RViz is pretty verbose, using 2 terminal windows will help reading the JSON printed on the terminal window.
Setup the environment
In each, terminal, source your environment and setup turtlebot configuration:
source /opt/ros/humble/setup.bash
source install/setup.bash
export GAZEBO_MODEL_PATH=$GAZEBO_MODEL_PATH:/opt/ros/humble/share/turtlebot3_gazebo/models
export TURTLEBOT3_MODEL=waffle
Start Navigation
Then, start the Turtlebot launchfile:
ros2 launch nav2_bringup tb3_simulation_launch.py headless:=False
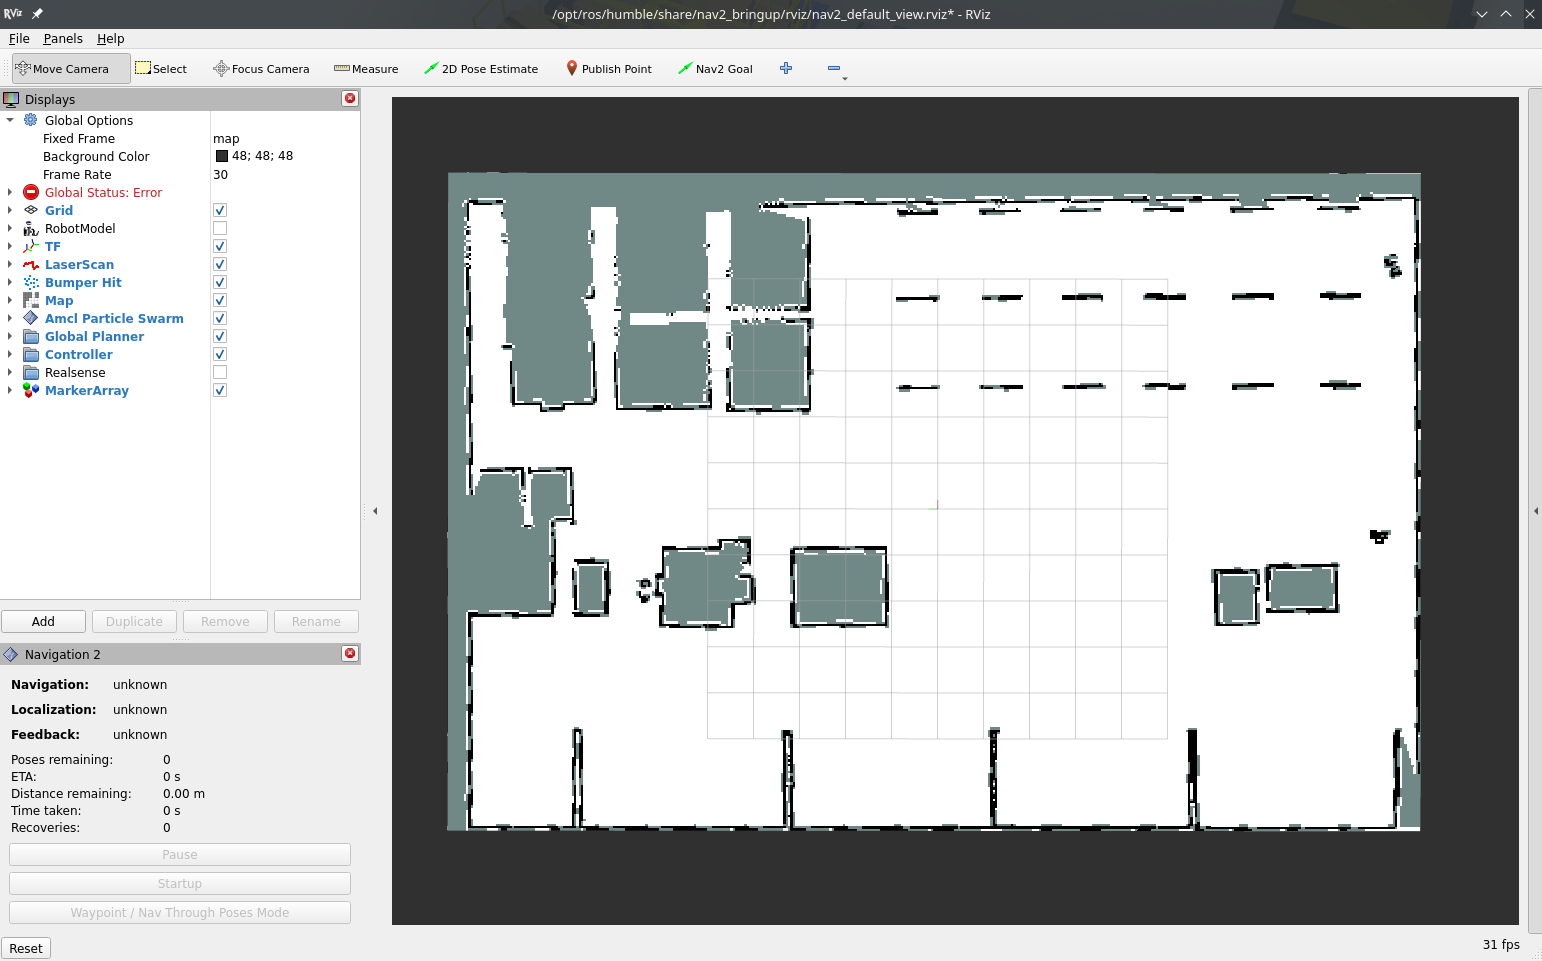
RViz and Gazebo will start: you should now see the robot in Gazebo, and the map on RViz.
Set the robot position using the "2D Pose Estimate" button.
If any problem occur, please take a look at the nav2 official documentation which covers the case.
Start DC
Execute
ros2 launch dc_demos tb3_simulation_stdout.launch.py
At the end, the data is displayed:
[component_container_isolated-1] [{"date":1677690777.96911,"width":384,"height":384,"remote_paths":{"minio":{"pgm":"C3PO/2023/03/01/17/map/2023-03-01T17:12:57.pgm","yaml":"C3PO/2023/03/01/17/map/2023-03-01T17:12:57.yaml"}},"resolution":0.05000000074505806,"origin":{"x":-10,"y":-10},"local_paths":{"pgm":"/root/dc_data/C3PO/2023/03/01/17/map/2023-03-01T17:12:57.pgm","yaml":"/root/dc_data/C3PO/2023/03/01/17/map/2023-03-01T17:12:57.yaml"},"id":"be781e5ffb1e7ee4f817fe7b63e92c32","robot_name":"C3PO","run_id":"234"}]
[component_container_isolated-1] [{"date":1677690782.883036,"width":384,"height":384,"remote_paths":{"minio":{"pgm":"C3PO/2023/03/01/17/map/2023-03-01T17:13:02.pgm","yaml":"C3PO/2023/03/01/17/map/2023-03-01T17:13:02.yaml"}},"resolution":0.05000000074505806,"origin":{"x":-10,"y":-10},"local_paths":{"pgm":"/root/dc_data/C3PO/2023/03/01/17/map/2023-03-01T17:13:02.pgm","yaml":"/root/dc_data/C3PO/2023/03/01/17/map/2023-03-01T17:13:02.yaml"},"id":"be781e5ffb1e7ee4f817fe7b63e92c32","robot_name":"C3PO","run_id":"234"}]
[component_container_isolated-1] [{"position":{"x":-0.7254206029057992,"yaw":0.134098723062189,"tags":["flb_stdout"],"y":-0.5116378019627142},"cmd_vel":{"tags":["flb_stdout"],"linear":{"x":0.26,"z":0,"y":0},"angular":{"x":0,"z":-0.157895,"y":0}},"speed":{"tags":["flb_stdout"],"linear":{"x":8.720555295508514e-05,"z":0,"y":4.219923511090644e-06},"computed":8.730759543499989e-05,"angular":{"x":-0.0002958005596118955}},"date":1677690787.878526,"id":"be781e5ffb1e7ee4f817fe7b63e92c32","robot_name":"C3PO","run_id":"234"}]
[component_container_isolated-1] [{"date":1677690787.883072,"width":384,"height":384,"remote_paths":{"minio":{"pgm":"C3PO/2023/03/01/17/map/2023-03-01T17:13:07.pgm","yaml":"C3PO/2023/03/01/17/map/2023-03-01T17:13:07.yaml"}},"resolution":0.05000000074505806,"origin":{"x":-10,"y":-10},"local_paths":{"pgm":"/root/dc_data/C3PO/2023/03/01/17/map/2023-03-01T17:13:07.pgm","yaml":"/root/dc_data/C3PO/2023/03/01/17/map/2023-03-01T17:13:07.yaml"},"id":"be781e5ffb1e7ee4f817fe7b63e92c32","robot_name":"C3PO","run_id":"234"}]
[component_container_isolated-1] [{"position":{"x":-0.1931822640325796,"yaw":-0.08553498481283986,"tags":["flb_stdout"],"y":-0.5267276846092974},"cmd_vel":{"tags":["flb_stdout"],"linear":{"x":0.232632,"z":0,"y":0},"angular":{"x":0,"z":-0.0526316,"y":0}},"speed":{"tags":["flb_stdout"],"linear":{"x":0.2466804589428482,"z":0,"y":4.147463233418404e-05},"computed":0.2466804624294339,"angular":{"x":-0.1575310923819759}},"date":1677690789.878385,"id":"be781e5ffb1e7ee4f817fe7b63e92c32","robot_name":"C3PO","run_id":"234"}]
[component_container_isolated-1] [{"position":{"x":-0.06732902212346159,"yaw":-0.06199357549188581,"tags":["flb_stdout"],"y":-0.5350783704643411},"cmd_vel":{"tags":["flb_stdout"],"linear":{"x":0.191579,"z":0,"y":0},"angular":{"x":0,"z":-0.0526316,"y":0}},"speed":{"tags":["flb_stdout"],"linear":{"x":0.2464715530337069,"z":0,"y":1.735682541426087e-05},"computed":0.2464715536448513,"angular":{"x":-0.05272644093984532}},"date":1677690790.878357,"id":"be781e5ffb1e7ee4f817fe7b63e92c32","robot_name":"C3PO","run_id":"234"}]
[component_container_isolated-1] [{"position":{"x":0.1426837169393564,"yaw":-0.1292500346335131,"tags":["flb_stdout"],"y":-0.5883037844577782},"cmd_vel":{"tags":["flb_stdout"],"linear":{"x":0,"z":0,"y":0},"angular":{"x":0,"z":0,"y":0}},"speed":{"tags":["flb_stdout"],"linear":{"x":0.1917414358977791,"z":0,"y":1.44170547699829e-05},"computed":0.1917414364397889,"angular":{"x":-0.05280628215810287}},"date":1677690791.878987,"id":"be781e5ffb1e7ee4f817fe7b63e92c32","robot_name":"C3PO","run_id":"234"}]
[component_container_isolated-1] [{"position":{"x":0.2658444927274801,"yaw":-0.1669572018597313,"tags":["flb_stdout"],"y":-0.6121168728850158},"cmd_vel":{"tags":["flb_stdout"],"linear":{"x":0,"z":0,"y":0},"angular":{"x":0,"z":0,"y":0}},"speed":{"tags":["flb_stdout"],"linear":{"x":3.645119603853573e-05,"z":0,"y":3.14134397110158e-06},"computed":3.658630528742332e-05,"angular":{"x":-0.0004012554003809027}},"date":1677690792.879082,"id":"be781e5ffb1e7ee4f817fe7b63e92c32","robot_name":"C3PO","run_id":"234"}]
[component_container_isolated-1] [{"date":1677690792.883126,"width":384,"height":384,"remote_paths":{"minio":{"pgm":"C3PO/2023/03/01/17/map/2023-03-01T17:13:12.pgm","yaml":"C3PO/2023/03/01/17/map/2023-03-01T17:13:12.yaml"}},"resolution":0.05000000074505806,"origin":{"x":-10,"y":-10},"local_paths":{"pgm":"/root/dc_data/C3PO/2023/03/01/17/map/2023-03-01T17:13:12.pgm","yaml":"/root/dc_data/C3PO/2023/03/01/17/map/2023-03-01T17:13:12.yaml"},"id":"be781e5ffb1e7ee4f817fe7b63e92c32","robot_name":"C3PO","run_id":"234"}
Given the JSON is quite large, let's analyze 2 different records:
The first one being the data published on the robot group:
[
  {
    "cmd_vel": {
      "linear": {
        "x": 0.246316,
        "y": 0,
        "z": 0
      },
      "angular": {
        "x": 0,
        "y": 0,
        "z": 0.263158
      }
    },
    "date": 1677694799.685468,
    "position": {
      "x": -0.6033772358727438,
      "yaw": -0.7146495585355921,
      "y": -1.633862970534114
    },
    "speed": {
      "angular": {
        "x": -0.0002542699063698451
      },
      "computed": 3.279051750818494e-05,
      "linear": {
        "x": 3.244397182637543e-05,
        "y": 4.754653571390878e-06,
        "z": 0
      }
    },
    "name": "robot",
    "id": "be781e5ffb1e7ee4f817fe7b63e92c32",
    "robot_name": "C3PO",
    "run_id": "240"
  }
]
This record contains the speed, cmd_vel and position from the group "robot". Not that the tags for each measurement have been dropped. This is because they won't be used in this particular group (they can be used as a single measurement)
[
  {
    "width": 384,
    "remote_paths": {
      "minio": {
        "yaml": "C3PO/2023/03/01/18/map/2023-03-01T18:20:16.yaml",
        "pgm": "C3PO/2023/03/01/18/map/2023-03-01T18:20:16.pgm"
      }
    },
    "name": "map",
    "resolution": 0.05000000074505806,
    "origin": {
      "x": -10,
      "y": -10
    },
    "local_paths": {
      "yaml": "/root/dc_data/C3PO/2023/03/01/18/map/2023-03-01T18:20:16.yaml",
      "pgm": "/root/dc_data/C3PO/2023/03/01/18/map/2023-03-01T18:20:16.pgm"
    },
    "date": 1677694816.690489,
    "height": 384,
    "id": "be781e5ffb1e7ee4f817fe7b63e92c32",
    "robot_name": "C3PO",
    "run_id": "240"
  }
]
This record contains the map data from the measurement.
Configuration
Measurement
measurement_server:
  ros__parameters:
    custom_str_params: ["robot_name"]
    robot_name: "C3PO"
    measurement_plugins: ["cmd_vel", "map", "position", "speed"]
    run_id:
      enabled: true
      counter: true
      counter_path: "$HOME/run_id"
      uuid: false
    save_local_base_path: "$HOME/dc_data/"
    all_base_path: "=robot_name/%Y/%m/%d/%H"
    cmd_vel:
      plugin: "dc_measurements/CmdVel"
      tags: ["flb_stdout"]
      group_key: "cmd_vel"
      enable_validator: true
      topic_output: "/dc/measurement/cmd_vel"
    position:
      plugin: "dc_measurements/Position"
      tags: ["flb_stdout"]
      group_key: "position"
      topic_output: "/dc/measurement/position"
      polling_interval: 1000
      enable_validator: true
      init_collect: true
      global_frame: "map"
      robot_base_frame: "base_link"
      transform_timeout: 0.1
    speed:
      plugin: "dc_measurements/Speed"
      tags: ["flb_stdout"]
      group_key: "speed"
      odom_topic: "/odom"
      topic_output: "/dc/measurement/speed"
    map:
      plugin: "dc_measurements/Map"
      tags: ["flb_stdout"]
      group_key: "map"
      polling_interval: 5000
      save_path: "map/%Y-%m-%dT%H:%M:%S"
      topic_output: "/dc/measurement/map"
      save_map_timeout: 4.0
      remote_prefixes: [""]
      remote_keys: ["minio"]
save_local_base_path (Optional): Used as a common base for all saved files from measurement plugins. all_base_path is concatenated to it afterwards for defining the path where files are saved.
all_base_path (Optional): Used as a common base for some measurements to save files. Is concatenated to save_local_base_path. Note the =robot_name, which is later replaced by C3PO (the variable defined in custom_str_params)
map.remote_keys: creates a dictionary inside remote_paths which is named by the strings in this field, which contains fields used by your API to fetch the remote URLs of the files.
Group
group_server:
  ros__parameters:
    groups: ["robot"]
    robot:
      inputs:
        [
          "/dc/measurement/cmd_vel",
          "/dc/measurement/position",
          "/dc/measurement/speed",
        ]
      output: "/dc/group/robot"
      sync_delay: 5.0
      group_key: "robot"
      tags: ["flb_stdout"]
      include_group_name: true
Create a group with data from cmd_vel, position and speed. Even though it appears there is nothing new here, I shall like to precise something important. In the previous demo, we mentioned that if all messages are not received by the group, it will drop it. It matters in this case because cmd_vel is not published all the time in this example (not when it is not moving), this means the data will be collected only when the robot moves (when a controller sends a command).
If you wished to collect the position and the speed constantly, you could take cmd_vel out of this group and add it in the destination.
Destinations
destination_server:
  ros__parameters:
    flb:
      flush: 1
      flb_grace: 1
      log_level: "info"
      storage_path: "/var/log/flb-storage/"
      storage_sync: "full"
      storage_checksum: "off"
      storage_backlog_mem_limit: "1M"
      scheduler_cap: 200
      scheduler_base: 5
      http_server: true
      http_listen: "0.0.0.0"
      http_port: 2020
      in_storage_type: "filesystem"
      in_storage_pause_on_chunks_overlimit: "off"
    destination_plugins: ["flb_stdout"]
    custom_str_params_list: ["robot_name", "id"]
    custom_str_params:
      robot_name:
        name: robot_name
        value: "C3PO"
      # Requires systemd package
      id:
        name: id
        value_from_file: /etc/machine-id
    flb_stdout:
      plugin: "dc_destinations/FlbStdout"
      inputs: ["/dc/group/robot", "/dc/measurement/map"]
      time_format: "double"
      time_key: "date"
      debug: false
Nothing new here, we simply edited the inputs in flb_stdout to ["/dc/group/robot", "/dc/measurement/map"] to get the data from the robot group and the map.
Console output
Now that the node started, let us see what's displayed in the console
[component_container_isolated-1] [INFO] [1677696067.792012776] [dc_container]: Load Library: /root/ws/install/dc_measurements/lib/libmeasurement_server_core.so
[component_container_isolated-1] [INFO] [1677696067.795921257] [dc_container]: Found class: rclcpp_components::NodeFactoryTemplate<measurement_server::MeasurementServer>
[component_container_isolated-1] [INFO] [1677696067.795956318] [dc_container]: Instantiate class: rclcpp_components::NodeFactoryTemplate<measurement_server::MeasurementServer>
[component_container_isolated-1] [INFO] [1677696067.811804437] [measurement_server]:
[component_container_isolated-1] 	measurement_server lifecycle node launched.
[component_container_isolated-1] 	Waiting on external lifecycle transitions to activate
[component_container_isolated-1] 	See https://design.ros2.org/articles/node_lifecycle.html for more information.
[component_container_isolated-1] [INFO] [1677696067.818755098] [measurement_server]: Base save path expanded to /root/dc_data/
[component_container_isolated-1] [INFO] [1677696067.818799565] [measurement_server]: All Base path expanded to C3PO/%Y/%m/%d/%H
[INFO] [launch_ros.actions.load_composable_nodes]: Loaded node '/measurement_server' in container 'dc_container'
[component_container_isolated-1] [INFO] [1677696067.821344112] [dc_container]: Load Library: /root/ws/install/dc_destinations/lib/libdestination_server_core.so
[component_container_isolated-1] [INFO] [1677696067.826089144] [dc_container]: Found class: rclcpp_components::NodeFactoryTemplate<destination_server::DestinationServer>
[component_container_isolated-1] [INFO] [1677696067.826138848] [dc_container]: Instantiate class: rclcpp_components::NodeFactoryTemplate<destination_server::DestinationServer>
[component_container_isolated-1] [INFO] [1677696067.845160790] [destination_server]:
[component_container_isolated-1] 	destination_server lifecycle node launched.
[component_container_isolated-1] 	Waiting on external lifecycle transitions to activate
[component_container_isolated-1] 	See https://design.ros2.org/articles/node_lifecycle.html for more information.
[INFO] [launch_ros.actions.load_composable_nodes]: Loaded node '/destination_server' in container 'dc_container'
[component_container_isolated-1] [INFO] [1677696067.856784495] [dc_container]: Load Library: /opt/ros/humble/lib/libnav2_lifecycle_manager_core.so
[component_container_isolated-1] [INFO] [1677696067.857836219] [dc_container]: Found class: rclcpp_components::NodeFactoryTemplate<nav2_lifecycle_manager::LifecycleManager>
[component_container_isolated-1] [INFO] [1677696067.857877118] [dc_container]: Instantiate class: rclcpp_components::NodeFactoryTemplate<nav2_lifecycle_manager::LifecycleManager>
[component_container_isolated-1] [INFO] [1677696067.875491851] [lifecycle_manager_navigation]: Creating
[INFO] [launch_ros.actions.load_composable_nodes]: Loaded node '/lifecycle_manager_navigation' in container 'dc_container'
[component_container_isolated-1] [INFO] [1677696067.881290824] [lifecycle_manager_navigation]: Creating and initializing lifecycle service clients
[component_container_isolated-1] [INFO] [1677696067.889491127] [lifecycle_manager_navigation]: Starting managed nodes bringup...
Measurement server and destination server are starting in the Lifecycle, you can read more about it here
"Base save path" and "All Base path" are also saved and expanded. Note "=robot_name" has been replaced by C3PO:
[component_container_isolated-1] [INFO] [1677696067.818755098] [measurement_server]: Base save path expanded to /root/dc_data/
[component_container_isolated-1] [INFO] [1677696067.818799565] [measurement_server]: All Base path expanded to C3PO/%Y/%m/%d/%H
Afterward, the measurement_server starts:
[component_container_isolated-1] [INFO] [1677694796.667666978] [lifecycle_manager_navigation]: Configuring measurement_server
[component_container_isolated-1] [INFO] [1677694796.667887325] [measurement_server]: Configuring
[component_container_isolated-1] [INFO] [1677694796.680348817] [measurement_server]: Creating measurement plugin cmd_vel: Type dc_measurements/CmdVel, Group key: cmd_vel, Polling interval: 1000, Debug: 0, Validator enabled: 1, Schema path: , Tags: [flb_stdout], Init collect: 1, Init Max measurement: 0, Include measurement name: 0, Include measurement plugin name: 0, Remote keys: , Remote prefixes: , Include measurement plugin name: 0, Max measurement on condition: 0, If all condition: , If any condition: , If none condition:
[component_container_isolated-1] [INFO] [1677694796.682517594] [measurement_server]: Configuring cmd_vel
[component_container_isolated-1] [INFO] [1677694796.684392643] [measurement_server]: Done configuring cmd_vel
[component_container_isolated-1] [INFO] [1677694796.684643767] [measurement_server]: Looking for schema at /root/ws/install/dc_measurements/share/dc_measurements/plugins/measurements/json/cmd_vel.json
[component_container_isolated-1] [INFO] [1677694796.684685350] [measurement_server]: schema: {"$defs":{"vector3":{"properties":{"x":{"description":"X speed","type":"number"},"y":{"description":"Y speed","type":"number"},"z":{"description":"Z speed","type":"number"}},"type":"object"}},"$schema":"http://json-schema.org/draft-07/schema#","description":"Command velocity sent to the robot","properties":{"angular":{"description":"Angular velocity as a vector","items":{"$ref":"#/$defs/vector3"},"type":"object"},"linear":{"description":"Linear velocity as a vector","items":{"$ref":"#/$defs/vector3"},"type":"object"}},"title":"Cmd_vel","type":"object"}
[component_container_isolated-1] [INFO] [1677694796.688143164] [measurement_server]: Creating measurement plugin map: Type dc_measurements/Map, Group key: map, Polling interval: 5000, Debug: 0, Validator enabled: 1, Schema path: , Tags: [flb_stdout], Init collect: 1, Init Max measurement: 0, Include measurement name: 1, Include measurement plugin name: 0, Remote keys: minio, Remote prefixes: , Include measurement plugin name: 0, Max measurement on condition: 0, If all condition: , If any condition: , If none condition:
[component_container_isolated-1] [INFO] [1677694796.689090088] [measurement_server]: Configuring map
[component_container_isolated-1] [INFO] [1677694796.690180661] [measurement_server]: Done configuring map
[component_container_isolated-1] [INFO] [1677694796.690522923] [measurement_server]: Looking for schema at /root/ws/install/dc_measurements/share/dc_measurements/plugins/measurements/json/map.json
[component_container_isolated-1] [INFO] [1677694796.690587274] [measurement_server]: schema: {"$defs":{"origin":{"description":"The 2-D pose of the lower-left pixel in the map, as (x, y, yaw), with yaw as counterclockwise rotation (yaw=0 means no rotation). Many parts of the system currently ignore yaw.","properties":{"x":{"description":"X origin of the robot","type":"number"},"y":{"description":"Y origin of the robot","type":"number"}},"type":"object"},"paths":{"properties":{"pgm":{"description":"Path to the map PGM file containing the gray-scale image","type":"string"},"yaml":{"description":"Path to the map YAML file containing map metadata","type":"string"}},"type":"object"}},"$schema":"http://json-schema.org/draft-07/schema#","description":"Map saved metadata and paths","properties":{"height":{"description":"Height of the PGM","minimum":0,"type":"integer"},"local_paths":{"description":"Paths where metadata and image are stored","items":{"$ref":"#/$defs/paths"},"type":"object"},"origin":{"description":"Robot origin position in meters","items":{"$ref":"#/$defs/origin"},"type":"object"},"remote_paths":{"additionalProperties":{"items":{"$ref":"#/$defs/paths"},"type":"object"},"description":"Dictionary of paths where metadata and image will be remotely stored","type":"object"},"resolution":{"description":"Resolution of the map, meters/pixel","minimum":0,"type":"number"},"width":{"description":"Width of the PGM","minimum":0,"type":"integer"}},"title":"Map","type":"object"}
[component_container_isolated-1] [INFO] [1677694796.693890952] [measurement_server]: Creating measurement plugin position: Type dc_measurements/Position, Group key: position, Polling interval: 1000, Debug: 0, Validator enabled: 1, Schema path: , Tags: [flb_stdout], Init collect: 1, Init Max measurement: 0, Include measurement name: 0, Include measurement plugin name: 0, Remote keys: , Remote prefixes: , Include measurement plugin name: 0, Max measurement on condition: 0, If all condition: , If any condition: , If none condition:
[component_container_isolated-1] [INFO] [1677694796.694797887] [measurement_server]: Configuring position
[component_container_isolated-1] [INFO] [1677694796.695799962] [measurement_server]: Done configuring position
[component_container_isolated-1] [INFO] [1677694796.696060904] [measurement_server]: Looking for schema at /root/ws/install/dc_measurements/share/dc_measurements/plugins/measurements/json/position.json
[component_container_isolated-1] [INFO] [1677694796.696114257] [measurement_server]: schema: {"$schema":"http://json-schema.org/draft-07/schema#","description":"Position and orientation of the robot","properties":{"x":{"description":"X position of the robot","type":"number"},"y":{"description":"Y position of the robot","type":"number"},"yaw":{"description":"Yaw angle of the robot","type":"number"}},"title":"Position","type":"object"}
[component_container_isolated-1] [INFO] [1677694796.699956883] [measurement_server]: Creating measurement plugin speed: Type dc_measurements/Speed, Group key: speed, Polling interval: 1000, Debug: 0, Validator enabled: 1, Schema path: , Tags: [flb_stdout], Init collect: 1, Init Max measurement: 0, Include measurement name: 0, Include measurement plugin name: 0, Remote keys: , Remote prefixes: , Include measurement plugin name: 0, Max measurement on condition: 0, If all condition: , If any condition: , If none condition:
[component_container_isolated-1] [INFO] [1677694796.701722429] [measurement_server]: Configuring speed
[component_container_isolated-1] [INFO] [1677694796.703057966] [measurement_server]: Done configuring speed
[component_container_isolated-1] [INFO] [1677694796.703357744] [measurement_server]: Looking for schema at /root/ws/install/dc_measurements/share/dc_measurements/plugins/measurements/json/speed.json
[component_container_isolated-1] [INFO] [1677694796.703413430] [measurement_server]: schema: {"$defs":{"vector3":{"properties":{"x":{"description":"X speed","type":"number"},"y":{"description":"Y speed","type":"number"},"z":{"description":"Z speed","type":"number"}},"type":"object"}},"$schema":"http://json-schema.org/draft-07/schema#","description":"Computed, linear and angular speed of the robot","properties":{"angular":{"description":"Angular velocity as a vector","items":{"$ref":"#/$defs/vector3"},"type":"object"},"computed":{"description":"Computed speed in meter/s","type":"number"},"linear":{"description":"Linear velocity as a vector","items":{"$ref":"#/$defs/vector3"},"type":"object"}},"title":"Speed","type":"object"}
Plugins are loaded one by one (here only one is, the uptime one) and configured. The configuration for each is displayed and the validation schema is also loaded and its path printed.
Then, the destination_server starts:
[component_container_isolated-1] [INFO] [1677694796.706019709] [lifecycle_manager_navigation]: Configuring destination_server
[component_container_isolated-1] [INFO] [1677694796.706162231] [destination_server]: Configuring
[component_container_isolated-1] [INFO] [1677694796.706907595] [destination_server]: Fluent Bit service initialized
[component_container_isolated-1] [INFO] [1677694796.707868171] [destination_server]: Creating destination plugin flb_stdout: Type dc_destinations/FlbStdout, Debug: 0, Time format: double. Time key: date
[component_container_isolated-1] [INFO] [1677694796.709554983] [destination_server]: Configuring Flb plugin flb_stdout
[component_container_isolated-1] [INFO] [1677694796.710263626] [destination_server]: Loaded lua filter. Match=ros2, code=function concatenate(tag, timestamp, record) if (type(record["tags"]) == "table") then record["tags"] = table.concat(record["tags"], ",") end  return 2, timestamp, record end
[component_container_isolated-1] [INFO] [1677694796.710309154] [destination_server]: Loaded rewrite_tag filter. Match=ros2, Rule=$tags .*(flb_stdout).* flb_stdout true
[component_container_isolated-1] [INFO] [1677694796.710382723] [destination_server]: Done configuring Flb plugin flb_stdout
[component_container_isolated-1] [INFO] [1677694796.710401937] [destination_server]: Loading input ros2 shared library /root/ws/install/fluent_bit_plugins/lib/flb-in_ros2.so...
[component_container_isolated-1] [INFO] [1677694796.711494520] [destination_server]: Loaded input ros2 shared library /root/ws/install/fluent_bit_plugins/lib/flb-in_ros2.so
[component_container_isolated-1] [INFO] [1677694796.711617719] [destination_server]: Flb ros2 plugin initialized. ret=0
[component_container_isolated-1] [INFO] [1677694796.711638189] [destination_server]: Starting Flb engine...
[component_container_isolated-1] [2023/03/01 18:19:56] [ info] [fluent bit] version=2.0.7, commit=1ab360f79c, pid=79925
[component_container_isolated-1] [2023/03/01 18:19:56] [ info] [storage] ver=1.3.0, type=memory+filesystem, sync=full, checksum=off, max_chunks_up=128
[component_container_isolated-1] [2023/03/01 18:19:56] [ info] [storage] backlog input plugin: storage_backlog.1
[component_container_isolated-1] [2023/03/01 18:19:56] [ info] [cmetrics] version=0.5.7
[component_container_isolated-1] [2023/03/01 18:19:56] [ info] [ctraces ] version=0.2.5
[component_container_isolated-1] [2023/03/01 18:19:56] [ info] [input:ros2:ros2.0] initializing
[component_container_isolated-1] [2023/03/01 18:19:56] [ info] [input:ros2:ros2.0] storage_strategy='filesystem' (memory + filesystem)
[component_container_isolated-1] [2023/03/01 18:19:56] [ info] Started node fluentbit_rclc
[component_container_isolated-1] [2023/03/01 18:19:56] [ info] Created subscriber /dc/group/robot
[component_container_isolated-1] [2023/03/01 18:19:56] [ info] Created subscriber /dc/measurement/map
[component_container_isolated-1] [2023/03/01 18:19:56] [ info] [input:storage_backlog:storage_backlog.1] initializing
[component_container_isolated-1] [2023/03/01 18:19:56] [ info] [input:storage_backlog:storage_backlog.1] storage_strategy='memory' (memory only)
[component_container_isolated-1] [2023/03/01 18:19:56] [ info] [input:storage_backlog:storage_backlog.1] queue memory limit: 976.6K
[component_container_isolated-1] [2023/03/01 18:19:56] [ info] [input:emitter:emitter_for_rewrite_tag.2] initializing
[component_container_isolated-1] [2023/03/01 18:19:56] [ info] [input:emitter:emitter_for_rewrite_tag.2] storage_strategy='filesystem' (memory + filesystem)
[component_container_isolated-1] [2023/03/01 18:19:56] [ info] [output:stdout:stdout.0] worker #0 started
[component_container_isolated-1] [2023/03/01 18:19:56] [ info] [http_server] listen iface=0.0.0.0 tcp_port=2020
[component_container_isolated-1] [2023/03/01 18:19:56] [ info] [sp] stream processor started
[component_container_isolated-1] [INFO] [1677694796.763937083] [destination_server]: Started Flb engine
All the same as with previous demos:
It starts the FlbStdout destination plugin, filters used internally by Fluent to edit Timestamps and tags. It then loads the ROS 2 Fluent Bit shared library and initialize it with the topics we provided as parameter.
Afterward, Fluent Bit starts, it prints its version, storage strategy and buffer configuration and lists which plugins are loaded.
Then, the measurement and destination server nodes are activated:
[component_container_isolated-1] [INFO] [1677668906.745180268] [lifecycle_manager_navigation]: Activating measurement_server
[component_container_isolated-1] [INFO] [1677668906.745462265] [measurement_server]: Activating
[component_container_isolated-1] [INFO] [1677668906.745558665] [measurement_server]: Activating uptime
[component_container_isolated-1] [INFO] [1677668906.746014639] [measurement_server]: Creating bond (measurement_server) to lifecycle manager.
[component_container_isolated-1] [INFO] [1677668906.853199899] [lifecycle_manager_navigation]: Server measurement_server connected with bond.
[component_container_isolated-1] [INFO] [1677668906.853316226] [lifecycle_manager_navigation]: Activating destination_server
[component_container_isolated-1] [INFO] [1677668906.853620571] [destination_server]: Activating
[component_container_isolated-1] [INFO] [1677668906.853722659] [destination_server]: Activating flb_stdout
[component_container_isolated-1] [INFO] [1677668906.853796078] [destination_server]: Creating bond (destination_server) to lifecycle manager.
[component_container_isolated-1] [INFO] [1677668906.961666207] [lifecycle_manager_navigation]: Server destination_server connected with bond.
[component_container_isolated-1] [INFO] [1677668906.961777773] [lifecycle_manager_navigation]: Managed nodes are active
[component_container_isolated-1] [INFO] [1677668906.961820078] [lifecycle_manager_navigation]: Creating bond timer...
Finally, we see the data:
[component_container_isolated-1] [{"remote_paths":{"minio":{"pgm":"C3PO/2023/03/01/18/map/2023-03-01T18:19:56.pgm","yaml":"C3PO/2023/03/01/18/map/2023-03-01T18:19:56.yaml"}},"date":1677694796.765904,"height":384,"name":"map","origin":{"x":-10,"y":-10},"local_paths":{"pgm":"/root/dc_data/C3PO/2023/03/01/18/map/2023-03-01T18:19:56.pgm","yaml":"/root/dc_data/C3PO/2023/03/01/18/map/2023-03-01T18:19:56.yaml"},"resolution":0.05000000074505806,"width":384,"id":"be781e5ffb1e7ee4f817fe7b63e92c32","robot_name":"C3PO","run_id":"240"}]
[component_container_isolated-1] [{"cmd_vel":{"linear":{"x":0.246316,"y":0,"z":0},"angular":{"x":0,"y":0,"z":0.263158}},"date":1677694799.685468,"position":{"x":-0.6033772358727438,"yaw":-0.7146495585355921,"y":-1.633862970534114},"speed":{"angular":{"x":-0.0002542699063698451},"computed":3.279051750818494e-05,"linear":{"x":3.244397182637543e-05,"y":4.754653571390878e-06,"z":0}},"name":"robot","id":"be781e5ffb1e7ee4f817fe7b63e92c32","robot_name":"C3PO","run_id":"240"}]
[component_container_isolated-1] [{"cmd_vel":{"linear":{"x":0.246316,"y":0,"z":0},"angular":{"x":0,"y":0,"z":0.263158}},"date":1677694800.685094,"position":{"x":-0.5307920077356227,"yaw":-0.645872441707418,"y":-1.693502983783379},"speed":{"angular":{"x":0.2127361022319145},"computed":0.2459393937023935,"linear":{"x":0.2459393844826374,"y":-6.734242603700924e-05,"z":0}},"name":"robot","id":"be781e5ffb1e7ee4f817fe7b63e92c32","robot_name":"C3PO","run_id":"240"}]
[component_container_isolated-1] [{"cmd_vel":{"linear":{"x":0.26,"y":0,"z":0},"angular":{"x":0,"y":0,"z":0.368421}},"date":1677694801.685017,"position":{"x":-0.3195900881047479,"yaw":-0.3944485529461182,"y":-1.813946939716471},"speed":{"angular":{"x":0.2623361481938653},"computed":0.24584231041888,"linear":{"x":0.2458423037516516,"y":-5.725533732485466e-05,"z":0}},"name":"robot","id":"be781e5ffb1e7ee4f817fe7b63e92c32","robot_name":"C3PO","run_id":"240"}]
So...what happened?
- The Nav2 turtlebot3 simulation starts, a robot is able to localize and move (once you use the 2-D pose estimate on RViz)
- The measurement plugins start publishing data to /dc/measurement/map, /dc/measurement/cmd_vel, /dc/measurement/position and /dc/measurement/speed, which contain the JSONs, tags and timestamp of the message
- In parallel, each time the map plugin sends a ROS message, it also saves the files on the filesystem. Open a file browser to the path you set in the configuration to a path mentioned in the map JSON
- The "robot" group node subscribes to /dc/measurement/cmd_vel, /dc/measurement/position and /dc/measurement/speed and publish on /dc/group/robot when it collects data from all 3 topics
- Run ID and robot_name is appended in the JSON of each
- The ROS 2 Fluent Bit plugin, which subscribes to the topics, receive the data and pass it on to Fluent Bit
- Fluent Bit receives it, applies the timestamp filter (which modifies the timestamp to the desired format)
- Fluent Bit applies changes the tag with another filter. This tag is used to match to the destination afterward.
- Data is flushed
- The Fluent Bit stdout output plugin receives the data because tags match (the flb_stdout tag is used) and forwards it to Stdout
Turtlebot3
In this example, we add a robot and start collecting robot data to Stdout.
You will also need 3 terminal windows, to:
- Run the Nav2 turtlebot3 launchfile: it starts localization, navigation and RViz
- Run navigation inspection demo
- Run DC
Using a different terminal window for DC helps reading its information.
Packages in the workspace
In addition to the ros2_data_collection repo in your workspace, you will need to download the aws warehouse package:
cd src
git clone https://github.com/aws-robotics/aws-robomaker-small-warehouse-world.git -b ros2
cd ..
colcon build
Setup the environment
Python dependencies
For this tutorial, we will need to install all dependencies:
pip3 install -r requirements.txt -r requirements-dev.txt
Setup Infrastructure
MinIO
MinIO will be used as storage for images and other files. To start it, follow the steps
Once you have your keys, edit the yaml configuration file at dc_demos/params/tb3_simulation_pgsql_minio.yaml by editing all instances of:
- access_key_id
- secret_access_key
PostgreSQL
PostgreSQL will be used as database storage for our JSON. Later on, backend engineers can make requests on those JSON based on measurement requested and time range. To start it, follow the steps
The default yaml configuration file does not need change as it also uses default values.
Setup simulation environment
In the terminal 1, source your environment, setup turtlebot configuration:
source /opt/ros/humble/setup.bash
source install/setup.bash
export GAZEBO_MODEL_PATH=$GAZEBO_MODEL_PATH:/opt/ros/humble/share/turtlebot3_gazebo/models
export GAZEBO_RESOURCE_PATH=${PWD}/src/aws-robomaker-small-warehouse-world/
export TURTLEBOT3_MODEL=waffle
source /usr/share/gazebo/setup.bash
Verify the gazebo world can be loaded properly:
gazebo /opt/ros/humble/share/aws_robomaker_small_warehouse_world/worlds/small_warehouse/small_warehouse.world
Gazebo will start with the warehouse environment. You can close it now.
I believe requiring the source along with those export are needed because of this issue
Terminal 1: Start Navigation
Then, in the same terminal (1), start the Turtlebot launchfile:
ros2 launch nav2_bringup tb3_simulation_launch.py \
    world:=/opt/ros/humble/share/aws_robomaker_small_warehouse_world/worlds/no_roof_small_warehouse/no_roof_small_warehouse.world \
    map:=/opt/ros/humble/share/aws_robomaker_small_warehouse_world/maps/005/map.yaml \
    headless:=False \
    x_pose:=3.45 \
    y_pose:=2.15 \
    yaw:=3.14
RViz and Gazebo will start: now you see the robot in Gazebo, and the map on RViz.
Terminal 2: Start DC
Run colcon build to compile the workspace:
colcon build
Now, start the demo:
ros2 launch dc_demos tb3_simulation_pgsql_minio.launch.py
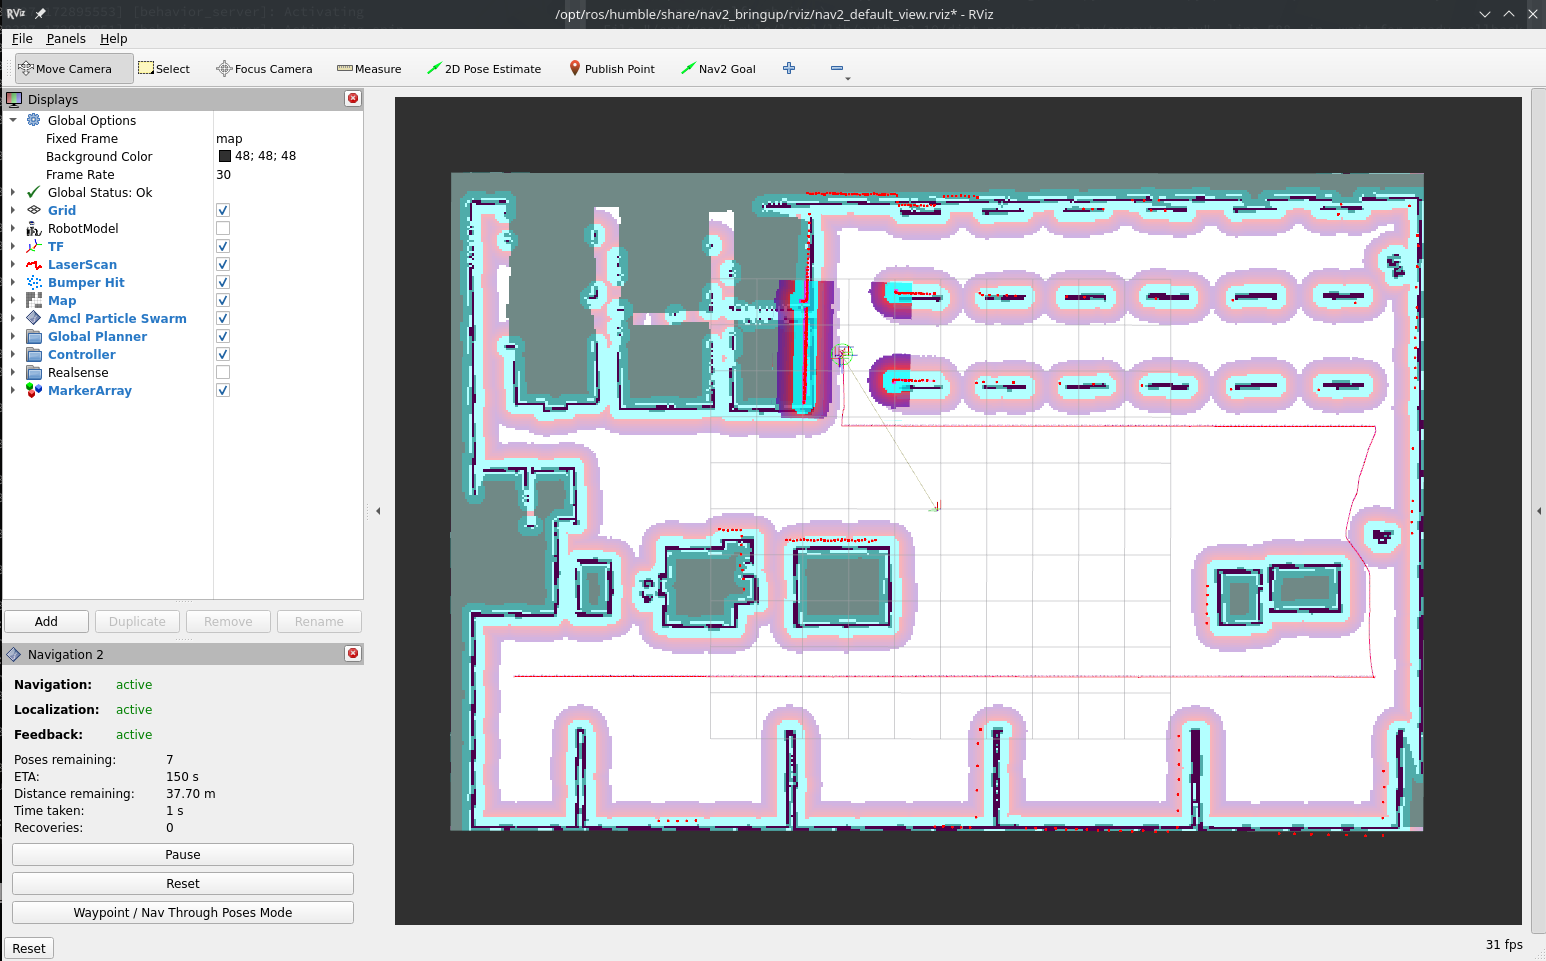
The robot will start collecting data.
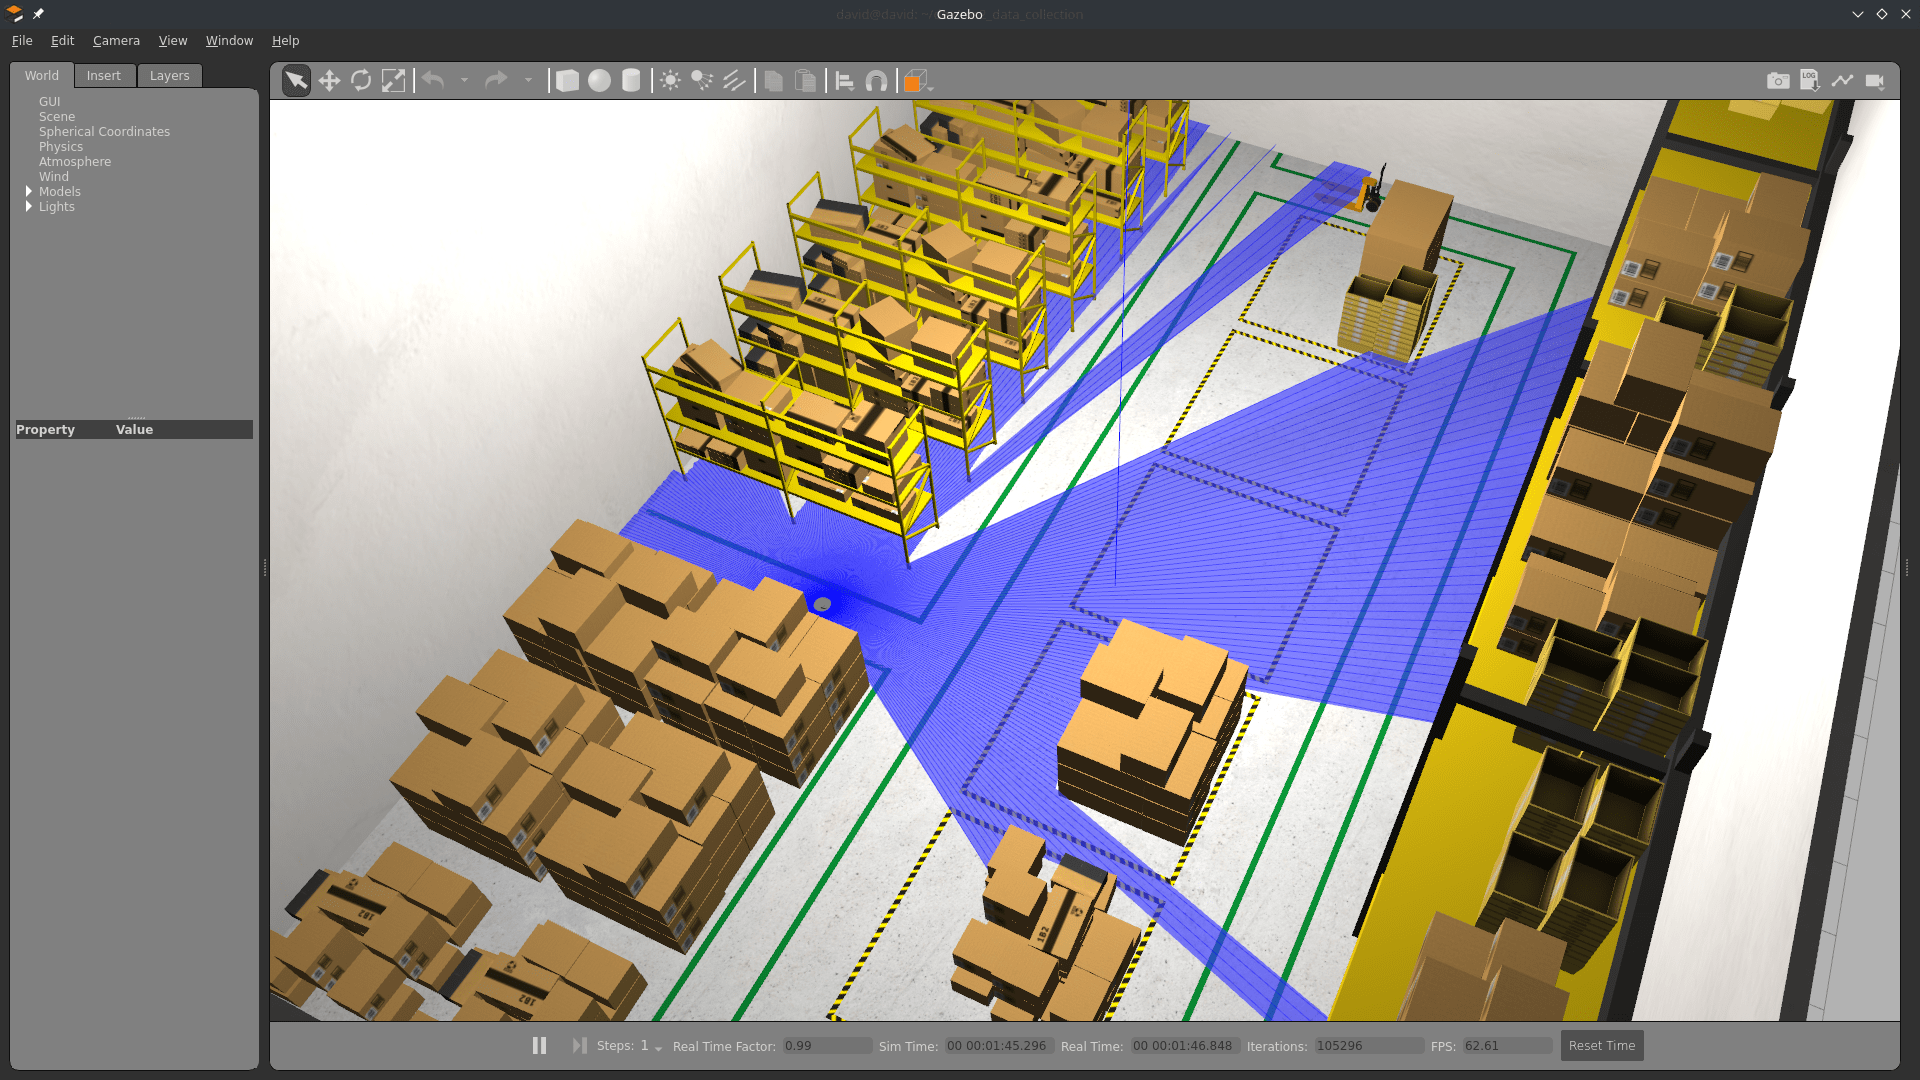
Terminal 3: Start autonomous navigation
Execute
ros2 run nav2_simple_commander demo_security
The robot will start moving and you will be able to see all visualizations activated in RViz:
Visualize the data
In the database
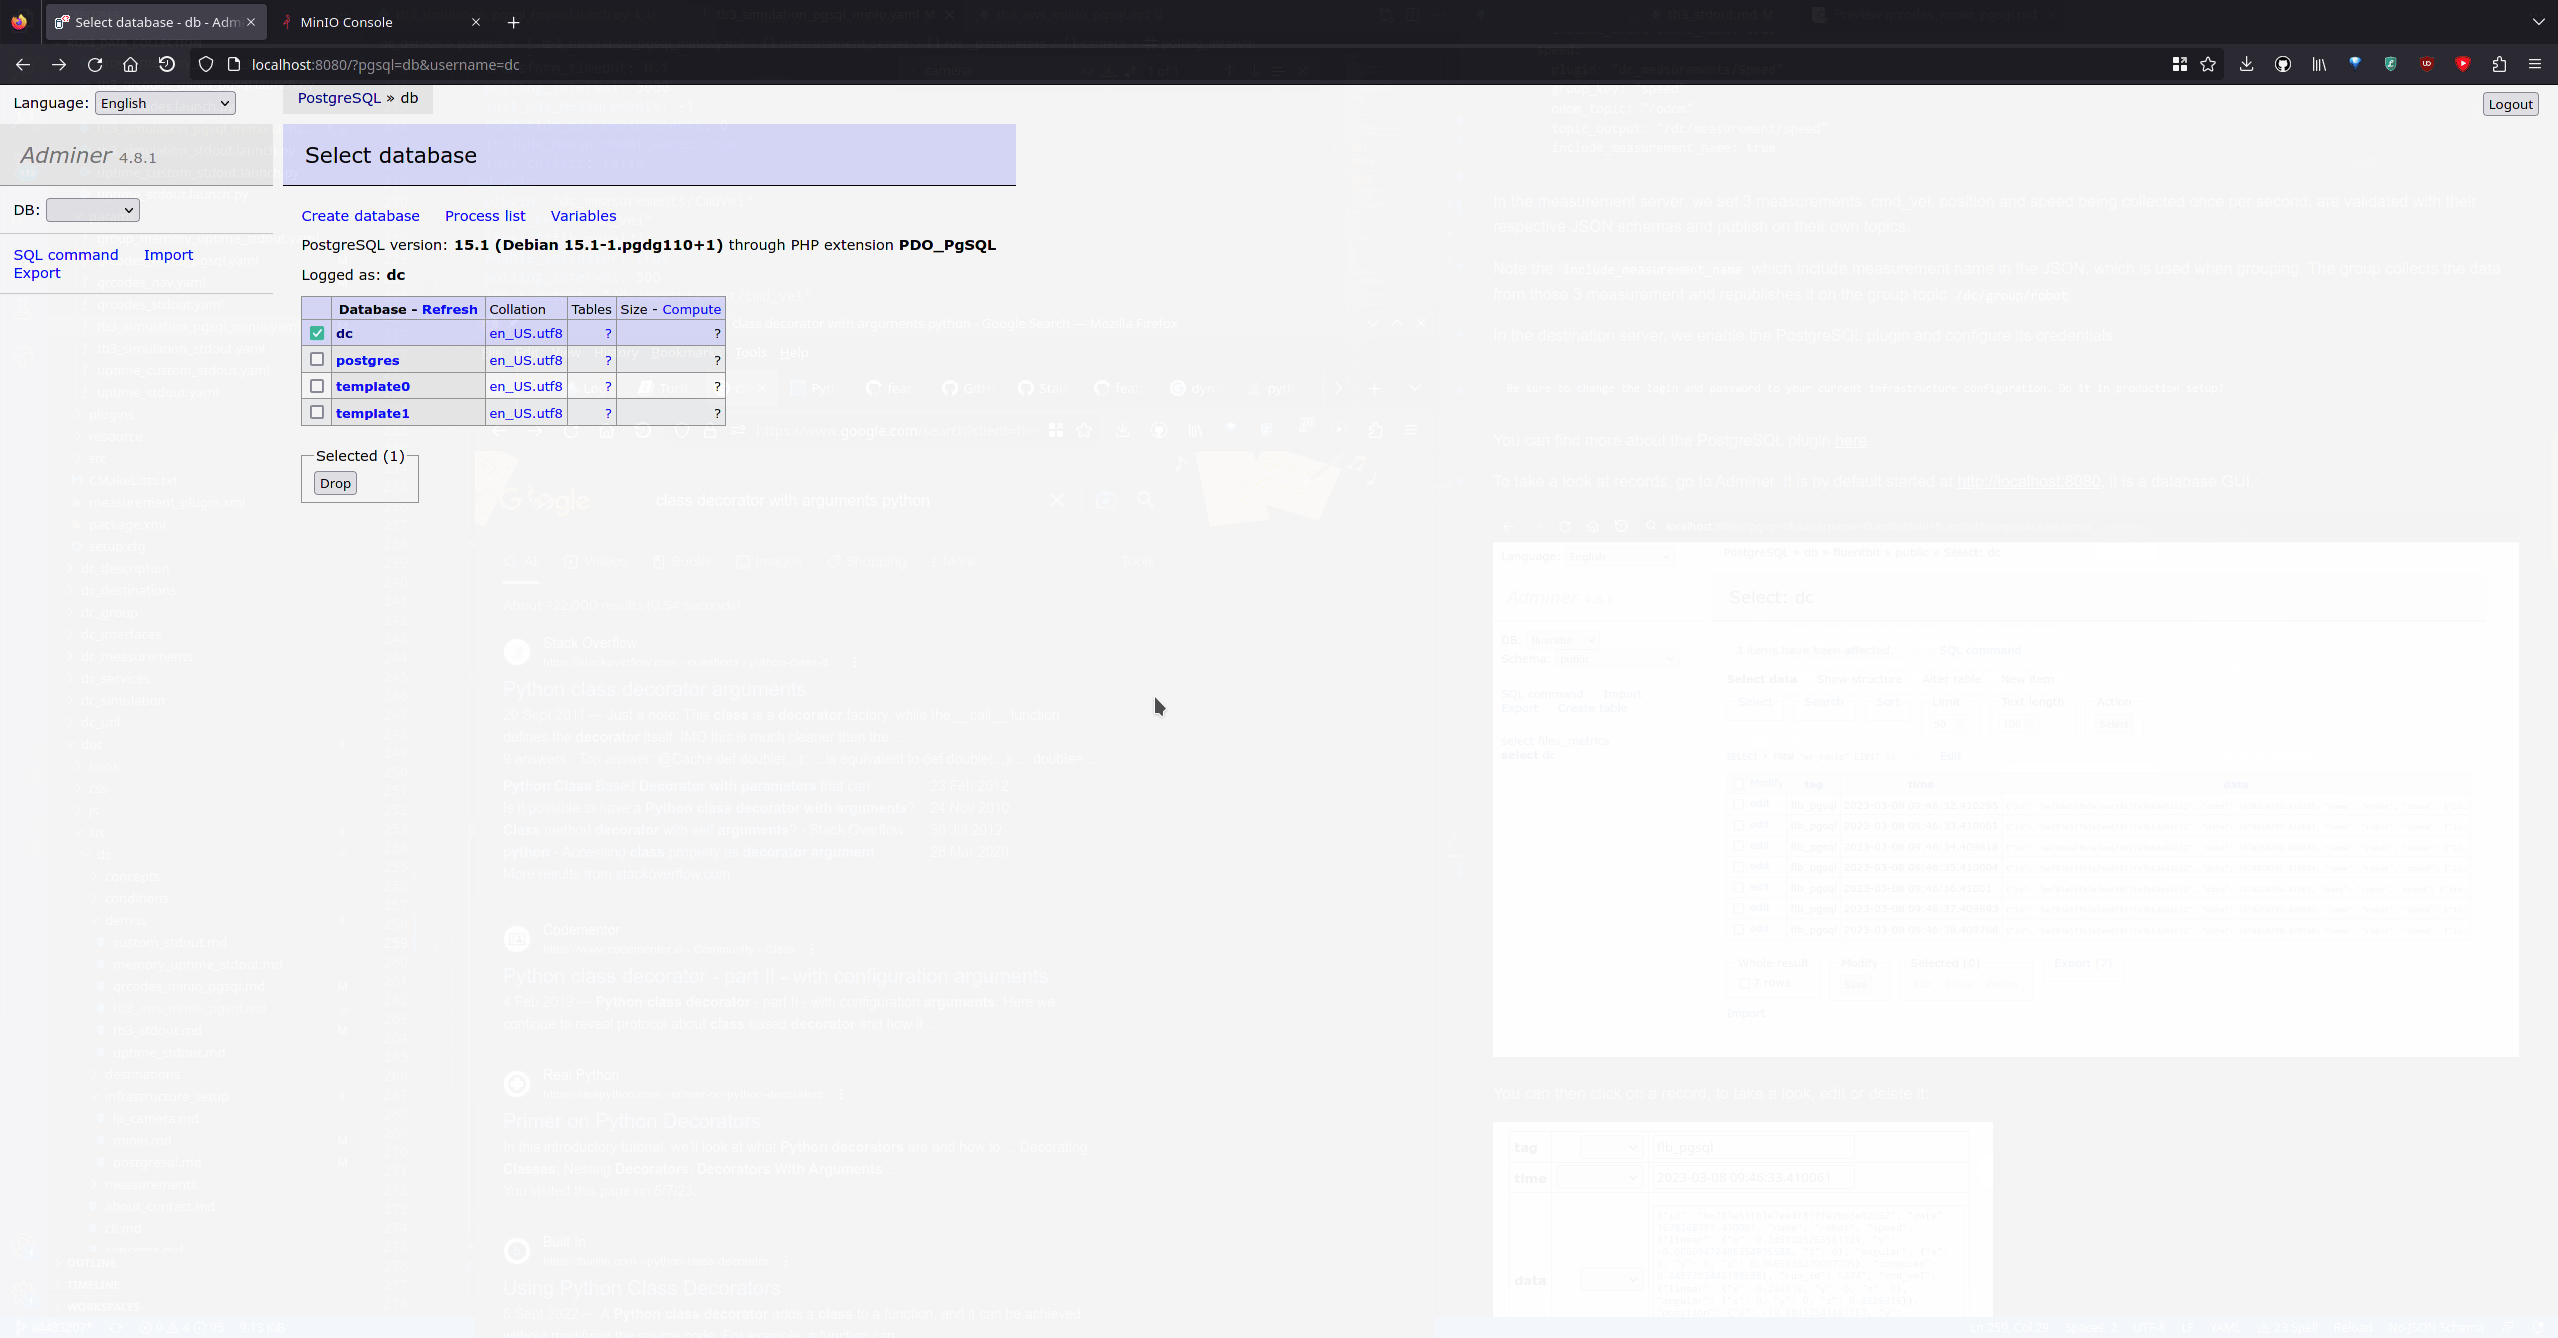
Navigate to localhost:8080
- Select dc database
- Select dc table
- Click on Select data
You will see rows filling the database. You can click on one to see its content:
In MinIO (file storage)
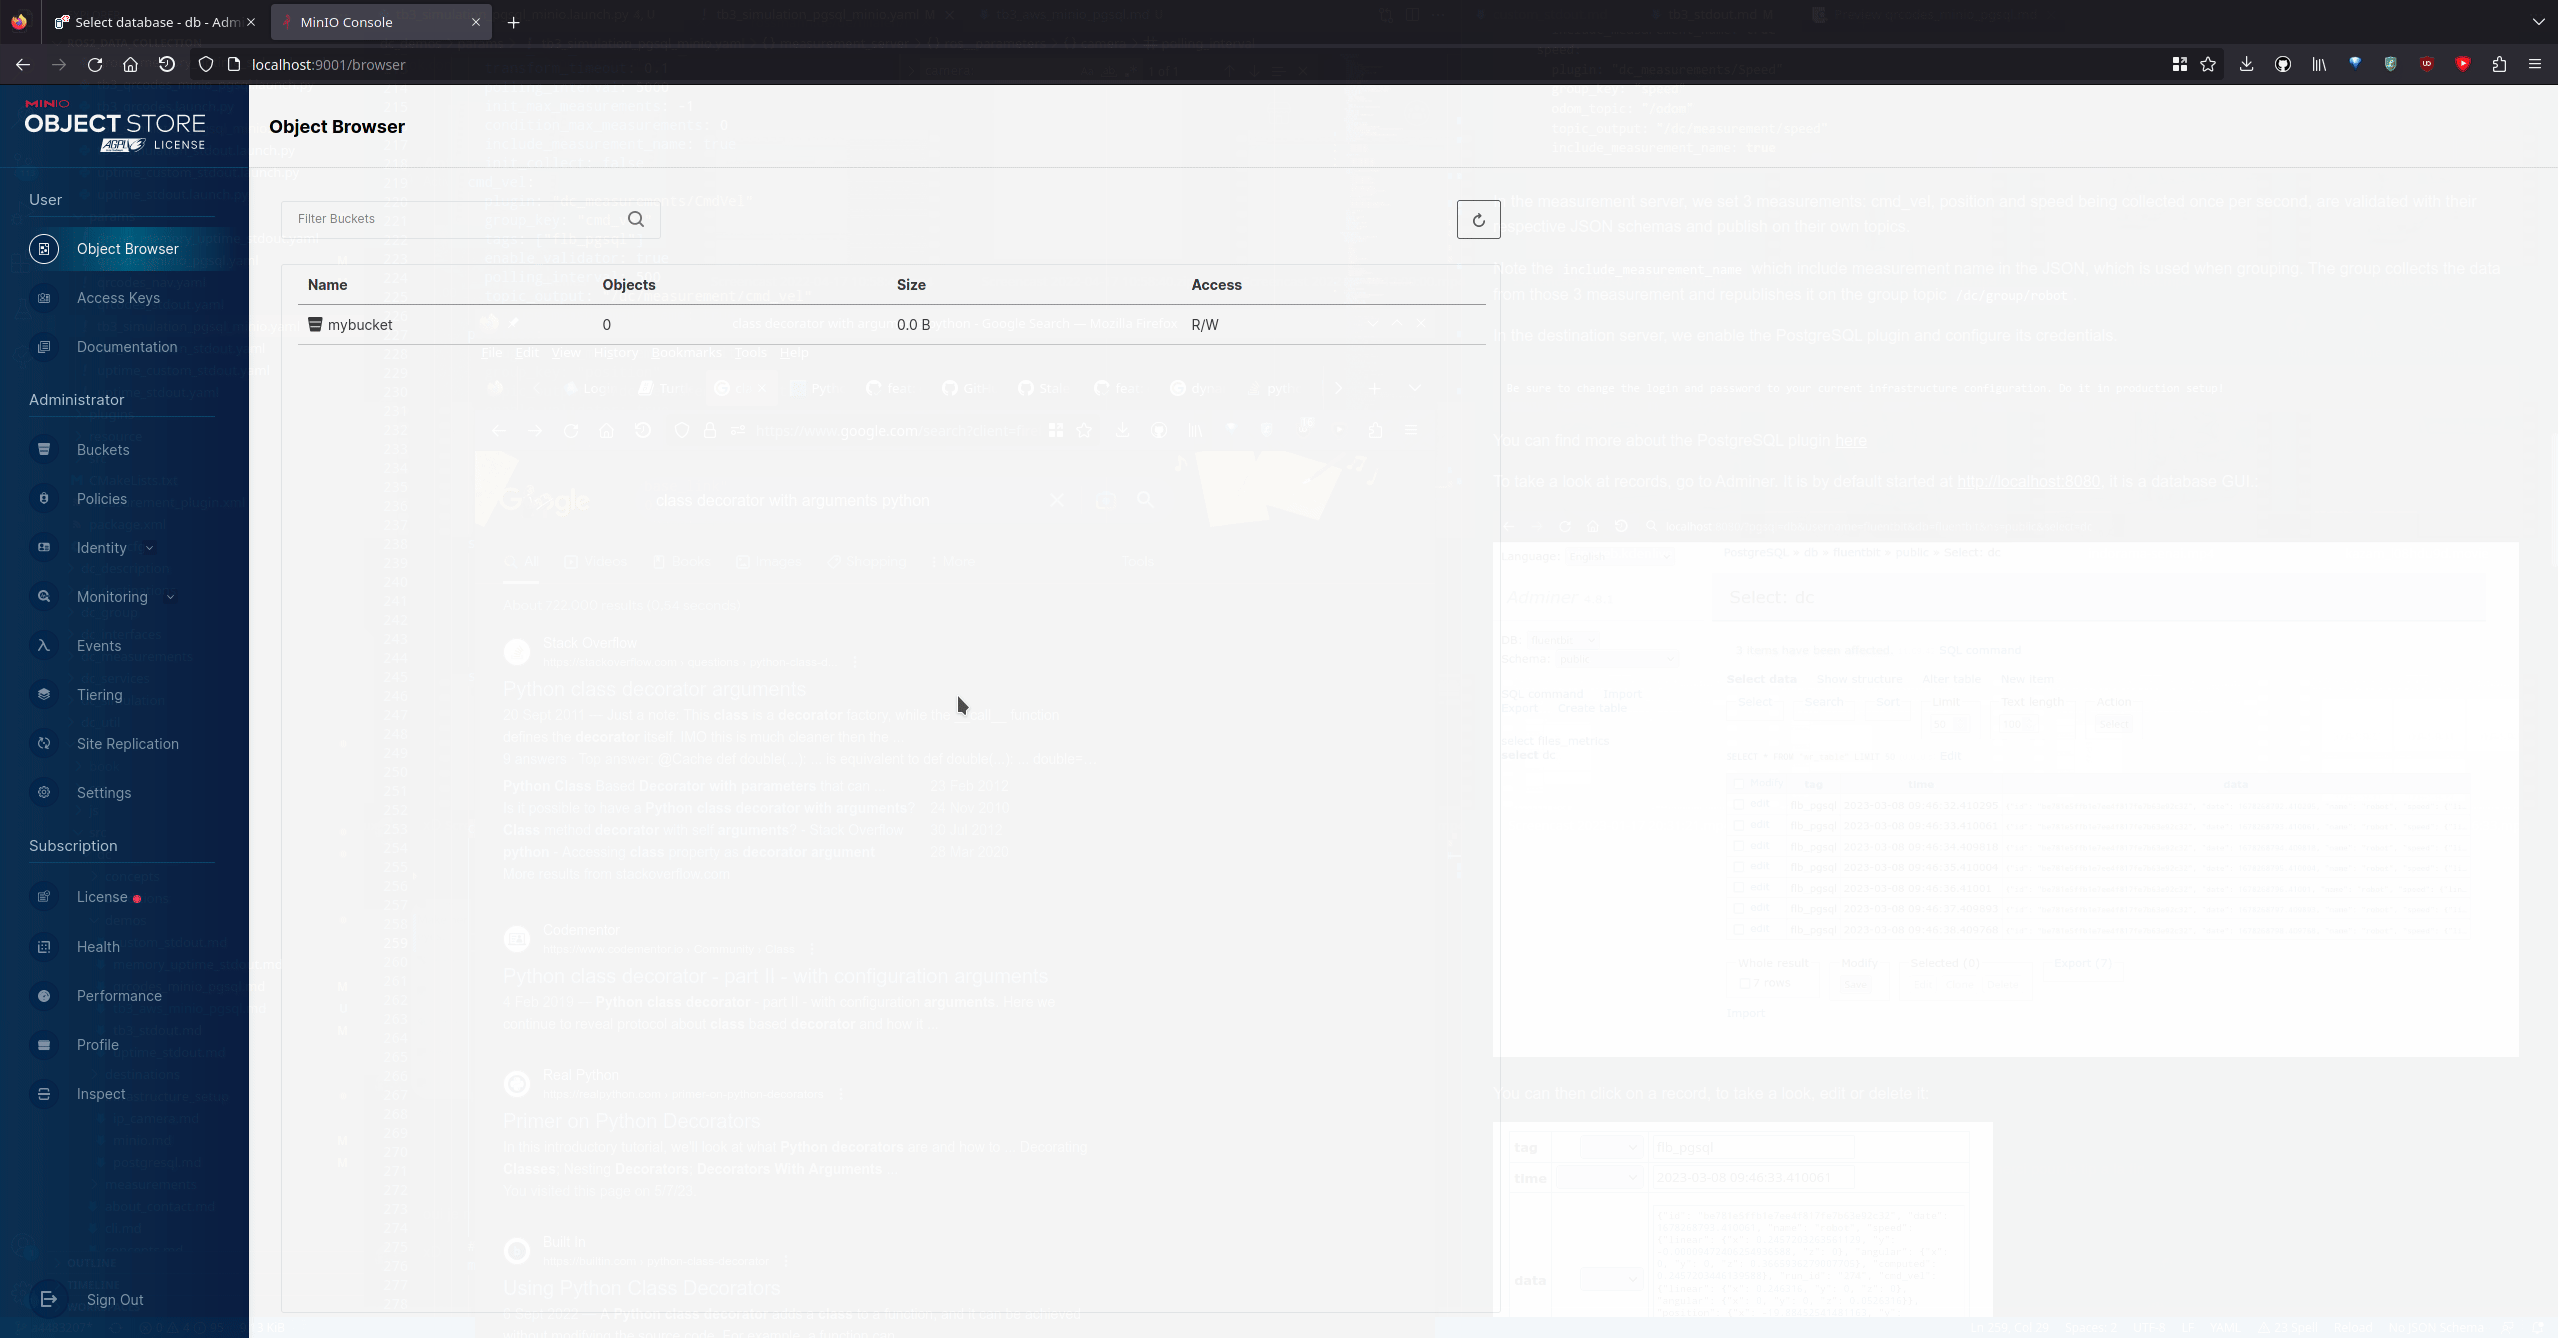
Navigate to localhost:9001
- Select mybucket bucket
- Click until you reach camera or map
- Continue until you reached a file, and click on preview (pgm can't be previewed)
You will see rows filling the database. You can click on one to see its content:
With Streamlit dashboard
A dashboard has been developed to help visualize the data collected.
Execute in a new terminal:
cd src/ros2_data_collection/dc_demos/dc_demos/streamlit_dashboard/
# Replace by what was created at the start of this demo
export MINIO_ACCESS_KEY=<YOUR_ACCESS_KEY>
# Replace by what was created at the start of this demo
export MINIO_SECRET_KEY=<YOUR_SECRET_KEY>
streamlit run Streamlit_ROS_2.py

# This will be printed:

  You can now view your Streamlit app in your browser.

  Local URL: http://localhost:8502
  Network URL: http://192.168.2.105:8502
Reach the address on your browser: localhost:8502. Here is a video of it:
That's it! Now you can collect your data!
Understanding the configuration
The full configuration file can be found here.
Measurement server
Measurements
measurement_plugins sets which plugin to load. We collect
System measurements:
Robot measurements:
Environment measurements:
Infrastructure measurements:
Each has their own configuration: polling interval, source topic, destination paths, topics used as input etc. Going through each of them would be too long here but you can check for each measurement its documentation and the general documentation of measurements
Conditions
We also initialize conditions:
- min_distance_traveled
- max_distance_traveled
They are used in the distance traveled measurement to only take values in a certain range.
Destination server
Here we enable the PostgreSQL and MinIO plugins since it is where we send the data.
PostgreSQL destination
We pass all topics generated by measurements. The node will subscribe to it and transfer the data to PostgreSQL. Note that not all data need to be sent to PostgreSQL, some could be sent elsewhere.
Along with the inputs, we pass the server configuration: username, password, database name etc.
MinIO destination
We pass the topics we want to subscribe to. Here only map and camera since those are the ones generating files.
The src_fields and upload_fields are fields in the JSON sent by the measurement where local and remote paths are stored so the plugin knows where to put the files.
Turtlebot3
In this example, we add a robot and start collecting robot data to Stdout.
You will also need 3 terminal windows, to:
- Run the Nav2 turtlebot3 launchfile: it starts localization, navigation and RViz
- Run navigation inspection demo
- Run DC
Using a different terminal window for DC helps reading its information.
Packages in the workspace
In addition to the ros2_data_collection repo in your workspace, you will need to download the aws warehouse package:
cd src
git clone https://github.com/aws-robotics/aws-robomaker-small-warehouse-world.git -b ros2
cd ..
colcon build
Setup the environment
Python dependencies
For this tutorial, we will need to install all dependencies:
pip3 install -r requirements.txt -r requirements-dev.txt
Setup the infrastructure
InfluxDB
InfluxDB will be used to store our data and timestamps. Later on, backend engineers can make requests on those JSON based on measurement requested and time range. To start it, follow the steps
Grafana
Grafana will be used to display the data as timeseries or statistics.
Setup simulation environment
In the terminal 1, source your environment, setup turtlebot configuration:
source /opt/ros/humble/setup.bash
source install/setup.bash
export GAZEBO_MODEL_PATH=$GAZEBO_MODEL_PATH:/opt/ros/humble/share/turtlebot3_gazebo/models
export GAZEBO_RESOURCE_PATH=${PWD}/src/aws-robomaker-small-warehouse-world/
export TURTLEBOT3_MODEL=waffle
source /usr/share/gazebo/setup.bash
Verify the gazebo world can be loaded properly:
gazebo /opt/ros/humble/share/aws_robomaker_small_warehouse_world/worlds/no_roof_small_warehouse/no_roof_small_warehouse.world
Gazebo will start with the warehouse environment. You can close it now.
I believe requiring the source along with those export are needed because of this issue
Terminal 1: Start Navigation
Then, in the same terminal (1), start the Turtlebot launchfile:
ros2 launch nav2_bringup tb3_simulation_launch.py \
    world:=/opt/ros/humble/share/aws_robomaker_small_warehouse_world/worlds/no_roof_small_warehouse/no_roof_small_warehouse.world \
    map:=/opt/ros/humble/share/aws_robomaker_small_warehouse_world/maps/005/map.yaml \
    headless:=False \
    x_pose:=3.45 \
    y_pose:=2.15 \
    yaw:=3.14
RViz and Gazebo will start: now you see the robot in Gazebo, and the map on RViz.
Terminal 2: Start DC
Run colcon build to compile the workspace:
colcon build
Now, start the demo:
ros2 launch dc_demos tb3_simulation_influxdb.launch.py
The robot will start collecting data.
Terminal 3: Start autonomous navigation
Execute
ros2 run nav2_simple_commander demo_security
The robot will start moving and you will be able to see all visualizations activated in RViz:
Visualize the data
With Grafana Dashboard
Open your browser at http://localhost:3000 and login with admin/admin
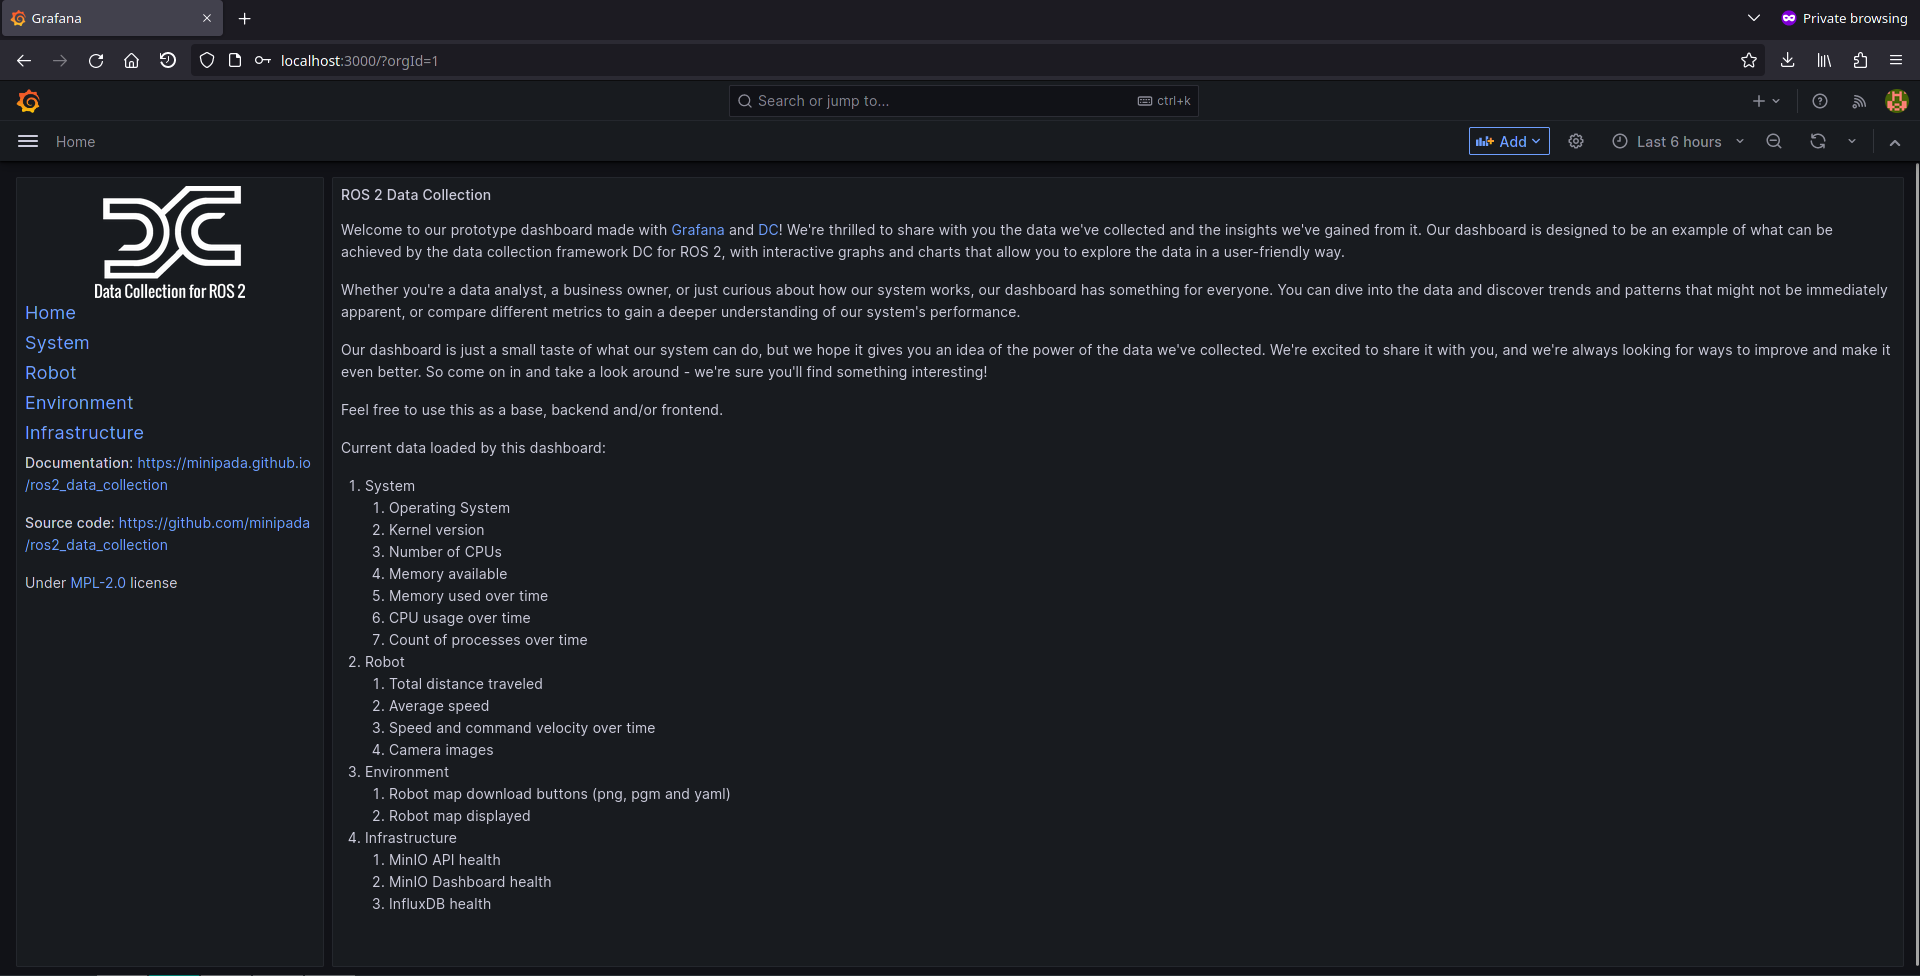
Understanding the configuration
The full configuration file can be found here.
Measurement server
Measurements
measurement_plugins sets which plugin to load. We collect
System measurements:
Robot measurements:
Environment measurements:
Infrastructure measurements:
Each has their own configuration: polling interval, source topic, destination paths, topics used as input etc. Going through each of them would be too long here but you can check for each measurement its documentation and the general documentation of measurements
Note that all measurements have the nested and flattened parameter set to True, this will transform each measurement to conform to how InfluxDB stores data. See nested and flattened in the measurements page.
Note also that all images (map and camera images) are stored as base64 strings because Grafana, the frontend at the end will only be able to access strings from the database.
Conditions
We also initialize conditions:
- min_distance_traveled
- max_distance_traveled
They are used in the distance traveled measurement to only take values in a certain range.
Destination server
Here we only enable the InfluxDB plugins since it is where we send the data.
At the end, we want to display the data on Grafana. Grafana can only display content stored on the connected database. This also includes images, which is why they are stored as base64 strings.
InfluxDB destination
We pass all topics generated by measurements. The node will subscribe to it and transfer the data to InfluxDB.
Along with the inputs, we pass the server credentials.
QRCodes
In this example, we add a robot and start collecting robot data to PostgreSQL and maps and scanned QRcodes to MinIO as image files.
You will also need 2 terminal windows, to:
- Run the Nav2 turtlebot3 launchfile: it starts localization, navigation and RViz
- Run DC
Since RViz is pretty verbose, using 3 terminal windows will help reading the JSON printed on the terminal window.
| Terminal | Description |
|---|---|
| RViz | Start it independently because of its verbosity |
| Nav2 | Localization and navigation |
| DC | Data collection |
Setup MinIO and PostgreSQL
MinIO
MinIO will be used as storage for images and other files. To start it, follow the steps
PostgreSQL
PostgreSQL will be used as database storage for our JSON. Later on, backend engineers can make requests on those JSON based on measurement requested and time range. To start it, follow the steps
Setup the ROS environment
In each, terminal, source your environment and setup turtlebot configuration:
source /opt/ros/humble/setup.bash
source install/setup.bash
export GAZEBO_MODEL_PATH=$GAZEBO_MODEL_PATH:/opt/ros/humble/share/turtlebot3_gazebo/models
export GAZEBO_MODEL_PATH=$GAZEBO_MODEL_PATH:/opt/ros/humble/share/aws_robomaker_small_warehouse_world/models/
export TURTLEBOT3_MODEL=waffle
Start RVIZ
ros2 run rviz2 rviz2 -d ${PWD}/install/dc_simulation/share/dc_simulation/rviz/qrcodes.rviz
Start Navigation
Then, start the Turtlebot launchfile with custom parameters to start the QRcode world:
ros2 launch nav2_bringup tb3_simulation_launch.py \
    headless:=False \
    x_pose:="-16.679400" \
    y_pose:="-15.300200" \
    z_pose:="0.01" \
    roll:="0.00" \
    pitch:="0.00" \
    yaw:="1.570796" \
    robot_sdf:="${PWD}/install/dc_simulation/share/dc_simulation/worlds/waffle.model" \
    map:="${PWD}/install/dc_simulation/share/dc_simulation/maps/qrcodes.yaml" \
    world:="${PWD}/install/dc_simulation/share/dc_simulation/worlds/qrcodes.world" \
    nav2_params_file:="${PWD}/install/dc_simulation/share/dc_demos/params/qrcodes_nav.yaml" \
    dc_params_file:="${PWD}/install/dc_simulation/share/dc_demos/params/qrcodes_minio_pgsql.yaml" \
    rviz_config_file:="${PWD}/install/dc_simulation/share/dc_simulation/rviz/qrcodes.rviz" \
    use_rviz:=False
RViz and Gazebo will start: you should now see the robot in Gazebo, and the map on RViz.
Set the robot position using the "2D Pose Estimate" button.
Start DC
Execute
ros2 launch dc_demos tb3_qrcodes_minio_pgsql.launch.py
With this, all data will be transmitted
Understanding the configuration
The full configuration file can be found here.
For this demo, we will reconstruct the yaml configuration element by element, given how large it is. Go through the explanation to understand how it works.
Collect command velocity, position and speed to PostgreSQL as a group
Similarly to the previous tutorial:
destination_server:
  ros__parameters:
    flb:
      flush: 1
      flb_grace: 1
      log_level: "info"
      storage_path: "/var/log/flb-storage/"
      storage_sync: "full"
      storage_checksum: "off"
      storage_backlog_mem_limit: "1M"
      scheduler_cap: 200
      scheduler_base: 5
      http_server: true
      http_listen: "0.0.0.0"
      http_port: 2020
      in_storage_type: "filesystem"
      in_storage_pause_on_chunks_overlimit: "off"
    destination_plugins: ["flb_pgsql"]
    flb_pgsql:
      plugin: "dc_destinations/FlbPgSQL"
      inputs: ["/dc/group/robot"]
      host: "127.0.0.1"
      port: 5432
      user: fluentbit
      password: password
      database: "fluentbit"
      table: "dc"
      timestamp_key: "date"
      async: false
      time_format: "double"
      time_key: "date"

group_server:
  ros__parameters:
    groups: ["robot"]
    robot:
      inputs:
        [
          "/dc/measurement/cmd_vel",
          "/dc/measurement/position",
          "/dc/measurement/speed",
        ]
      output: "/dc/group/robot"
      sync_delay: 5.0
      group_key: "robot"
      tags: ["flb_pgsql"]

measurement_server:
  ros__parameters:
    custom_str_params: ["robot_name"]
    robot_name: "C3PO"
    measurement_plugins: ["cmd_vel", "position", "speed"]
    custom_str_params_list: ["robot_name", "id"]
    custom_str_params:
      robot_name:
        name: robot_name
        value: "C3PO"
      # Requires systemd package
      id:
        name: id
        value_from_file: /etc/machine-id
    run_id:
      enabled: true
      counter: true
      counter_path: "$HOME/run_id"
      uuid: false
    moving:
      plugin: "dc_conditions/Moving"
    cmd_vel:
      plugin: "dc_measurements/CmdVel"
      group_key: "cmd_vel"
      enable_validator: true
      topic_output: "/dc/measurement/cmd_vel"
      include_measurement_name: true
    position:
      plugin: "dc_measurements/Position"
      group_key: "position"
      topic_output: "/dc/measurement/position"
      enable_validator: true
      global_frame: "map"
      robot_base_frame: "base_link"
      transform_timeout: 0.1
      include_measurement_name: true
    speed:
      plugin: "dc_measurements/Speed"
      group_key: "speed"
      odom_topic: "/odom"
      topic_output: "/dc/measurement/speed"
      include_measurement_name: true
In the measurement server, we set 3 measurements: cmd_vel, position and speed being collected once per second, are validated with their respective JSON schemas and publish on their own topics.
Note the include_measurement_name which include measurement name in the JSON, which is used when grouping. The group collects the data from those 3 measurement and republishes it on the group topic /dc/group/robot.
In the destination server, we enable the PostgreSQL plugin and configure its credentials.
Be sure to change the login and password to your current infrastructure configuration. Do it in production setup!
You can find more about the PostgreSQL plugin here
To take a look at records, go to Adminer. It is by default started at http://localhost:8080, it is a database GUI.:
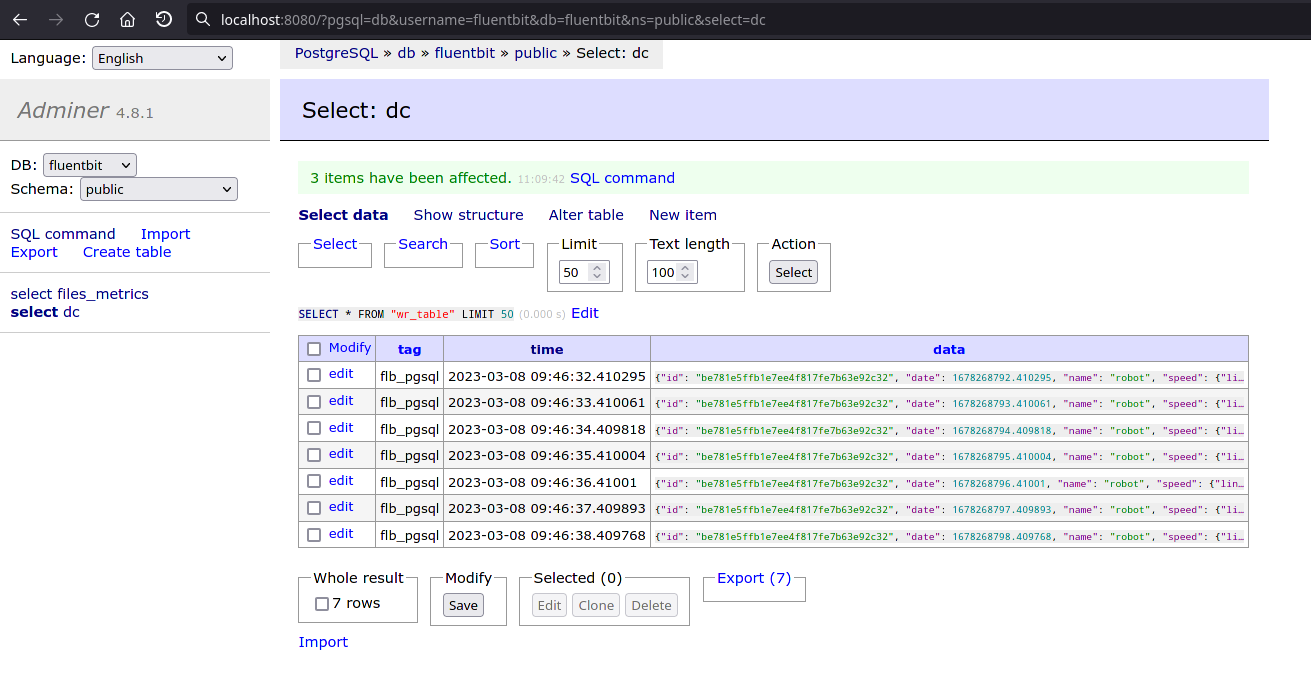
You can then click on a record, to take a look, edit or delete it:
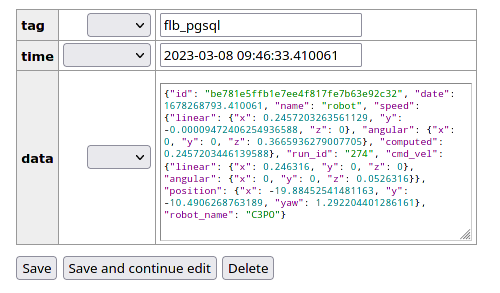
Send the map image and YAML from nav2_map_server to MinIO
First, we add the map measurement. We use 3 plugins here: flb_pgsql to send the data to PostgreSQL on the dc database, then flb_minio to send some files to MinIO and flb_files_metrics which will be used to autodelete the files once they reach their destination.
measurement_server:
  ros__parameters:
  ...
  measurement_plugins: ["map"]
  map:
    plugin: "dc_measurements/Map"
    group_key: "map"
    polling_interval: 5000
    save_path: "map/%Y-%m-%dT%H:%M:%S"
    topic_output: "/dc/measurement/map"
    save_map_timeout: 4.0
    remote_prefixes: [""]
    remote_keys: ["minio"]
    enable_validator: true
    tags: ["flb_pgsql", "flb_minio", "flb_files_metrics"]
    include_measurement_name: true
  ...
Then we add the destinations:
destination_server:
  ros__parameters:
    ...
    destination_plugins: ["flb_files_metrics", "flb_pgsql", "flb_minio"]
    flb_files_metrics:
      plugin: "dc_destinations/FlbFilesMetrics"
      inputs: ["/dc/measurement/map"]
      file_storage: ["minio"]
      db_type: "pgsql"
      delete_when_sent: true
      minio:
        endpoint: 127.0.0.1:9000
        access_key_id: rQXPf1f730Yuu2yW # Change it
        secret_access_key: TYYkjN5L4gqDgCGLzQahHDcvqL4WNTcb # Change it
        use_ssl: false
        bucket: "mybucket"
        src_fields: ["local_paths.pgm", "local_paths.yaml"]
        upload_fields: ["remote_paths.minio.pgm", "remote_paths.minio.yaml"]
        input_names: ["map", "map"]
      pgsql:
        host: "127.0.0.1"
        port: "5432"
        user: fluentbit # Change it
        password: password # Change it
        database: "fluentbit"
        table: "files_metrics"
        timestamp_key: "date"
        time_format: "double"
        time_key: "date"
        ssl: false
    flb_minio:
      verbose_plugin: false
      time_format: "iso8601"
      plugin: "dc_destinations/FlbMinIO"
      inputs: ["/dc/measurement/map"]
      endpoint: 127.0.0.1:9000
      access_key_id: rQXPf1f730Yuu2yW # Change it
      secret_access_key: TYYkjN5L4gqDgCGLzQahHDcvqL4WNTcb # Change it
      use_ssl: false
      create_bucket: true
      bucket: "mybucket" # Change it
      src_fields: ["local_paths.pgm", "local_paths.yaml"]
      upload_fields: ["remote_paths.minio.pgm", "remote_paths.minio.yaml"]
    flb_pgsql:
      plugin: "dc_destinations/FlbPgSQL"
      inputs: ["/dc/group/map"]
      host: "127.0.0.1"
      port: 5432
      user: fluentbit
      password: password
      database: "fluentbit"
      table: "dc"
      timestamp_key: "date"
      async: false
      time_format: "double"
      time_key: "date"
This will save the map pgm and yaml every 5 seconds to MinIO. Head to the MinIO GUI, which is by default located at http://localhost:9001. Default user/password are minioadmin/minioadmin.
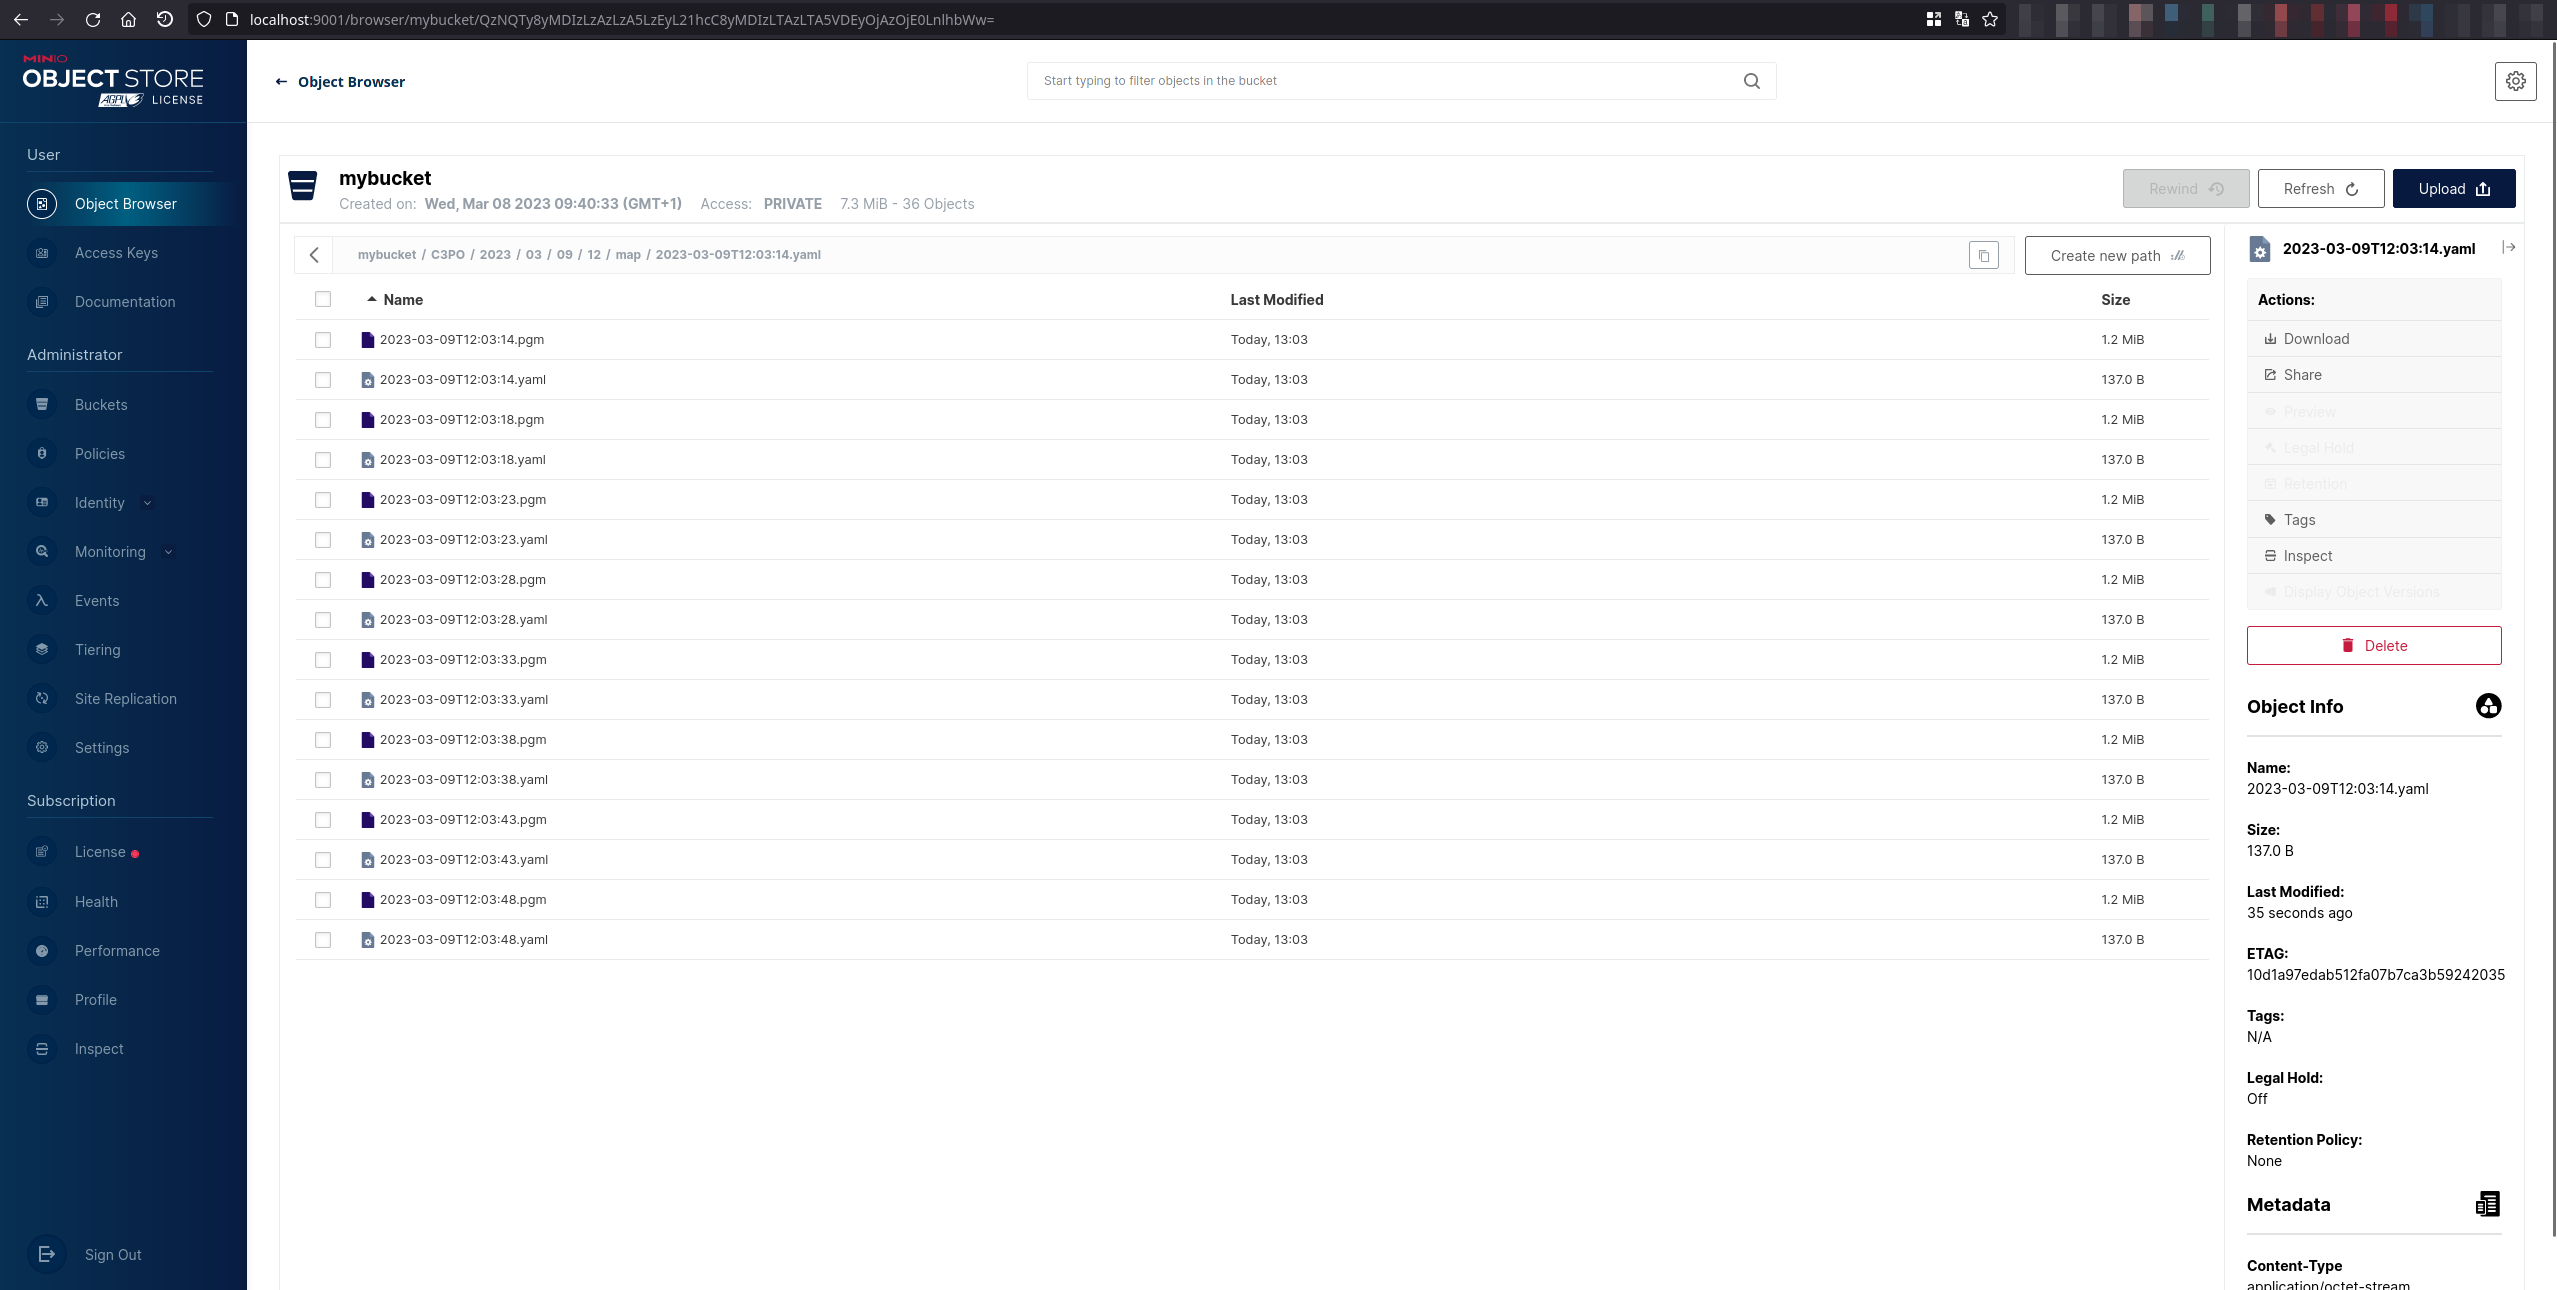
It will also save the map metadata on PostgreSQL, which you can later use to know the map location on MinIO and its dimensions for example:
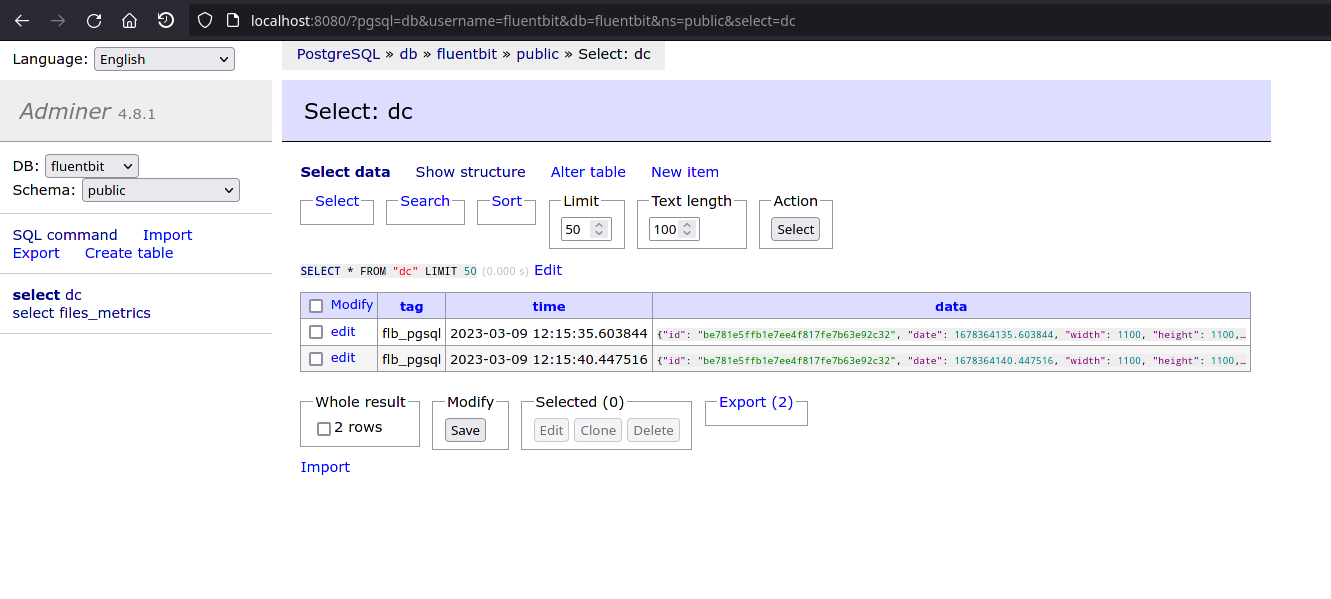
We also transmit the metadata, to be fetched later on by the backend (map dimension and path). It is set in the flb_pgsql measurement plugin.
The flb_metrics plugin is also enabled. We use it to track if the file is on the filesystem and also delete it once it reaches its destination, here MinIO. This plugins deletes file when they are sent with the delete_when_sent parameter. More about the plugin here
Then, similarly, on Adminer, you can check the data is uploaded and deleted:
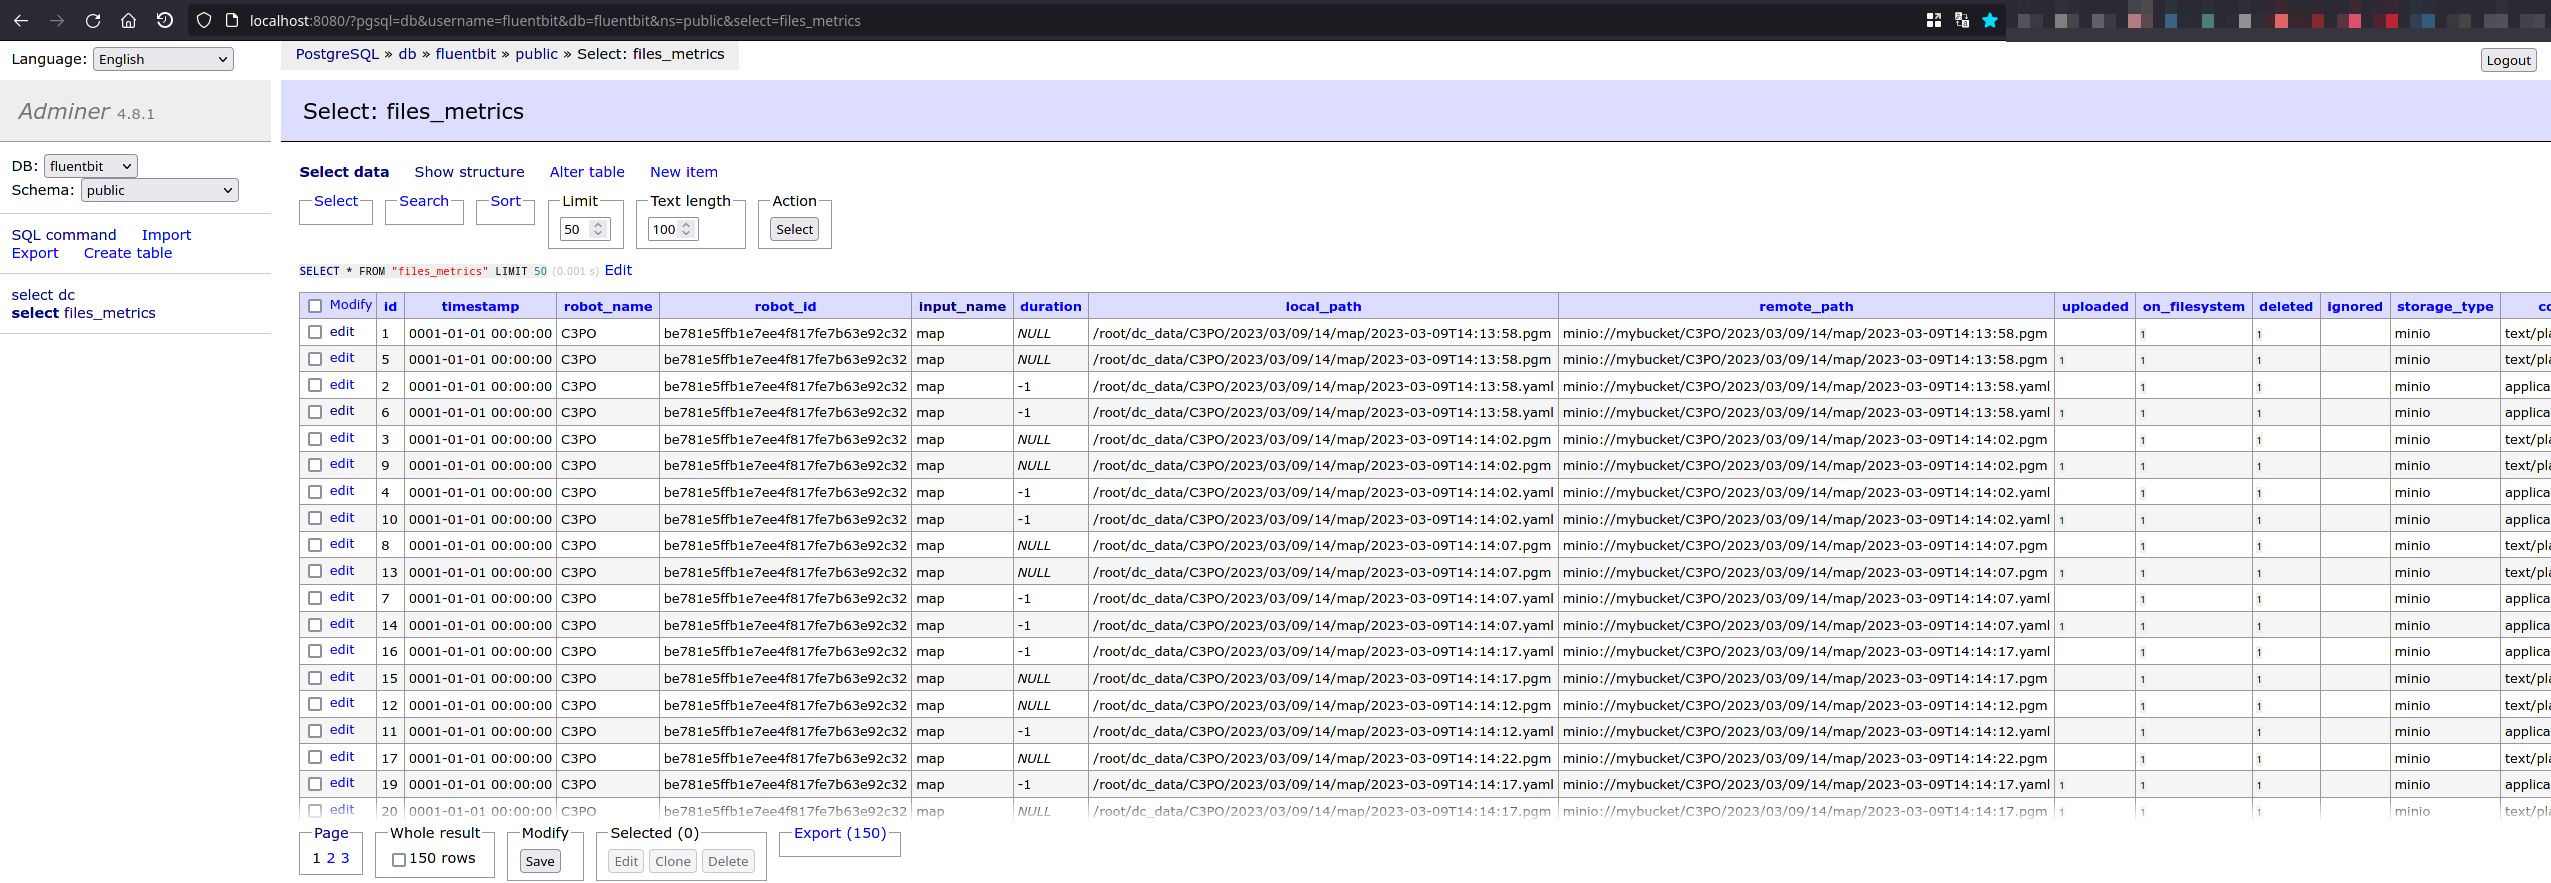
Send QR code images to MinIO
We want to collect pictures taken by the cameras
measurement_server:
  ros__parameters:
  ...
  measurement_plugins: ["right_camera", "left_camera"]
  condition_plugins: ["moving", "inspected_exists"]
  custom_str_params_list: ["robot_name", "id"]
  custom_str_params:
    robot_name:
      name: robot_name
      value: "C3PO"
    # Requires systemd package
    id:
      name: id
      value_from_file: /etc/machine-id
  run_id:
    enabled: true
    counter: true
    counter_path: "$HOME/run_id"
    uuid: false
  destinations:
    minio:
      bucket: mybucket
  moving:
    plugin: "dc_conditions/Moving"
  inspected_exists:
    plugin: "dc_conditions/Exist"
    key: "inspected"
  right_camera:
    plugin: "dc_measurements/Camera"
    group_key: "right_camera"
    if_none_conditions: ["moving"]
    if_all_conditions: ["inspected_exists"]
    topic_output: "/dc/measurement/right_camera"
    init_collect: false
    init_max_measurements: -1
    condition_max_measurements: 1
    node_name: "dc_measurement_camera"
    cam_topic: "/right_intel_realsense_r200_depth/image_raw"
    cam_name: right_camera
    enable_validator: true
    draw_det_barcodes: true
    save_raw_img: false
    save_rotated_img: false
    save_detections_img: true
    save_inspected_path: "right_camera/inspected/%Y-%m-%dT%H-%M-%S"
    rotation_angle: 0
    detection_modules: ["barcode"]
    remote_prefixes: [""]
    remote_keys: ["minio"]
    tags: ["flb_pgsql", "flb_minio", "flb_files_metrics"]
    include_measurement_name: true
  left_camera:
    plugin: "dc_measurements/Camera"
    group_key: "left_camera"
    if_none_conditions: ["moving"]
    if_all_conditions: ["inspected_exists"]
    topic_output: "/dc/measurement/left_camera"
    init_collect: true
    init_max_measurements: -1
    condition_max_measurements: 1
    node_name: "dc_measurement_camera"
    cam_topic: "/left_intel_realsense_r200_depth/image_raw"
    cam_name: left_camera
    enable_validator: true
    draw_det_barcodes: true
    save_raw_img: false
    save_rotated_img: false
    save_detections_img: true
    save_inspected_path: "left_camera/inspected/%Y-%m-%dT%H-%M-%S"
    rotation_angle: 0
    detection_modules: ["barcode"]
    remote_prefixes: [""]
    remote_keys: ["minio"]
    tags: ["flb_pgsql", "flb_minio", "flb_files_metrics"]
    include_measurement_name: true
  ...
Taking a look at the cameras, we can understand that:
- Data is only collected when the robot is not moving:
if_none_conditions: ["moving"] - Data is only collected when there is inspected data, so only when a QR code is detected:
if_all_conditions: ["inspected_exists"] - Data is not collected constantly:
init_max_measurements: -1 - Only one record is collected when conditions are triggered:
condition_max_measurements: 1 - Only images with inspected data are collected:
save_raw_img: falsesave_rotated_img: falsesave_detections_img: true
- Barcodes are scanned in each image:
detection_modules: ["barcode"]
For the files-metrics, it is very important to have include_measurement_name since it relies on it to know in which field needs the paths are.
Then we add the destination:
destination_server:
  ros__parameters:
  ...
    destination_plugins: ["flb_minio", "flb_pgsql", "flb_files_metrics"]
    flb_files_metrics:
      plugin: "dc_destinations/FlbFilesMetrics"
      inputs:
        [
          "/dc/measurement/right_camera",
          "/dc/measurement/left_camera",
        ]
      file_storage: ["minio"]
      db_type: "pgsql"
      delete_when_sent: true
      minio:
        endpoint: 127.0.0.1:9000
        access_key_id: rQXPf1f730Yuu2yW
        secret_access_key: TYYkjN5L4gqDgCGLzQahHDcvqL4WNTcb
        use_ssl: false
        bucket: "mybucket"
        src_fields:
          [
            "local_paths.inspected",
            "local_paths.inspected"
          ]
        upload_fields:
          [
            "remote_paths.minio.inspected",
            "remote_paths.minio.inspected"
          ]
      pgsql:
        host: "127.0.0.1"
        port: "5432"
        user: fluentbit
        password: password
        database: "fluentbit"
        table: "files_metrics"
        timestamp_key: "date"
        time_format: "double"
        time_key: "date"
        ssl: false
    flb_minio:
      verbose_plugin: false
      time_format: "iso8601"
      plugin: "dc_destinations/FlbMinIO"
      inputs: ["/dc/measurement/right_camera", "/dc/measurement/left_camera"]
      endpoint: 127.0.0.1:9000
      access_key_id: rQXPf1f730Yuu2yW
      secret_access_key: TYYkjN5L4gqDgCGLzQahHDcvqL4WNTcb
      use_ssl: false
      bucket: "mybucket"
      src_fields:
        [
          "local_paths.inspected",
          "local_paths.inspected"
        ]
      upload_fields:
        [
          "remote_paths.minio.inspected",
          "remote_paths.minio.inspected"
        ]
    flb_pgsql:
      plugin: "dc_destinations/FlbPgSQL"
      inputs:
        [
          "/dc/measurement/right_camera",
          "/dc/measurement/left_camera",
        ]
      host: "127.0.0.1"
      port: 5432
      user: fluentbit
      password: password
      database: "fluentbit"
      table: "dc"
      timestamp_key: "date"
      async: false
      time_format: "double"
      time_key: "date"
Here, we collect images with the MinIO plugin, also send metadata to PostreSQL.
In addition, flb_files_metrics tracks when the files are sent to MinIO and deletes them when it is done. Note that multiple destinations can be configured for each field. Check the plugin documentation to see which remote destinations are supported.
Custom uptime to Stdout
In this demo, we will go through a new use case. You want to create your own measurement or use an existing measurement provided by dc_measurements but not exactly, you want to add a field and also modify the JSON schema. That is what we will do here: create a new plugin, inside dc_demos, another package, create a plugin and load it
We are going to take the uptime measurement, change it slightly and collect the data.
To test it, run:
ros2 launch dc_demos uptime_custom_stdout.launch.py
JSON schema
Located in dc_demos/plugins/measurements/json/uptime_custom.json:
{
  "$schema": "http://json-schema.org/draft-07/schema#",
  "title": "Uptime Custom",
  "description": "Time the system has been up. Intentionally failing to demonstrate customization and callback",
  "properties": {
    "time": {
      "description": "Time the system has been up",
      "type": "integer",
      "maximum": 0
    }
  },
  "type": "object"
}
It is almost the same as the standard uptime, but for the sake of the example, we will set the maximum value to 0, which will certainly make the validation fail!
CPP code
First, we create a hpp file in dc_demos/include/dc_demos/plugins/measurements:
#ifndef DC_DEMOS__PLUGINS__MEASUREMENTS__UPTIME_CUSTOM_HPP_
#define DC_DEMOS__PLUGINS__MEASUREMENTS__UPTIME_CUSTOM_HPP_

#include <nlohmann/json.hpp>

#include "dc_measurements/measurement.hpp"
#include "dc_measurements/plugins/measurements/uptime.hpp"

namespace dc_demos
{
using json = nlohmann::json;

class UptimeCustom : public dc_measurements::Uptime
{
protected:
  void onFailedValidation(json data_json) override;
  void setValidationSchema() override;
};

}  // namespace dc_demos

#endif  // DC_DEMOS__PLUGINS__MEASUREMENTS__UPTIME_CUSTOM_HPP_
We create a new class UptimeCustom, which inherits from dc_measurements::Uptime.
If we wanted to start a new measurement from scratch, it would inherit from dc_core::Measurement.
The method onFailedValidation is not mandatory but it is here to show it is possible to trigger a custom function when the validation fails.
Then the cpp code, currently located in dc_demos/plugins/measurements/uptime_custom.cpp:
#include "dc_demos/plugins/measurements/uptime_custom.hpp"

namespace dc_demos
{

void UptimeCustom::onFailedValidation(json data_json)
{
  (void)data_json;
  RCLCPP_INFO(logger_, "Callback! Validation failed for uptime custom");
}

void UptimeCustom::setValidationSchema()
{
  if (enable_validator_)
  {
    validateSchema("dc_demos", "uptime_custom.json");
  }
}

}  // namespace dc_demos

#include "pluginlib/class_list_macros.hpp"
PLUGINLIB_EXPORT_CLASS(dc_demos::UptimeCustom, dc_core::Measurement)
We include the uptime_custom file header. Then, define the onFailedValidation function (triggered when validation fails) and the setValidationSchema function which sets the json with the new json schema
Plugin file
Create the xml file, here will be measurement_plugin.xml for us, at the source of the package. It defines the plugins of the package.
<class_libraries>
    <library path="dc_uptime_custom_measurement">
        <class name="dc_demos/UptimeCustom" type="dc_demos::UptimeCustom" base_class_type="dc_core::Measurement">
            <description>
                dc_measurement_uptime_custom
            </description>
        </class>
    </library>
</class_libraries>
CMakeLists.txt
Now that you have all files set up, you can add the build process to the CMakeLists.txt:
# Measurement plugins
add_library(dc_uptime_custom_measurement SHARED
  plugins/measurements/uptime_custom.cpp
)
list(APPEND dc_measurement_plugin_libs dc_uptime_custom_measurement)

foreach(measurement_plugin ${dc_measurement_plugin_libs})
  ament_target_dependencies(${measurement_plugin} ${dependencies})
  target_link_libraries(
    ${measurement_plugin}
  )
  target_compile_definitions(${measurement_plugin} PRIVATE BT_PLUGIN_EXPORT)
endforeach()

pluginlib_export_plugin_description_file(dc_core measurement_plugin.xml)

install(FILES measurement_plugin.xml
  DESTINATION share/${PROJECT_NAME}
)

install(DIRECTORY plugins/measurements/
  DESTINATION share/${PROJECT_NAME}/plugins/measurements/
)
It creates the library, installs and exports it.
Console output
In the measurement server log, the plugin is detected properly
[component_container_isolated-1] [INFO] [1677715629.547448938] [measurement_server]: Creating measurement plugin uptime_custom: Type dc_demos/UptimeCustom, Group key: uptime, Polling interval: 5000, Debug: 0, Validator enabled: 1, Schema path: , Tags: [flb_stdout], Init collect: 1, Init Max measurement: 0, Include measurement name: 0, Include measurement plugin name: 0, Remote keys: , Remote prefixes: , Include measurement plugin name: 0, Max measurement on condition: 0, If all condition: , If any condition: , If none condition:
...
[component_container_isolated-1] [INFO] [1677715629.550523128] [measurement_server]: schema: {"$schema":"http://json-schema.org/draft-07/schema#","description":"Time the system has been up. Intentionally failing to demonstrate customization and callback","properties":{"time":{"description":"Time the system has been up","maximum":0,"type":"integer"}},"title":"Uptime Custom","type":"object"}
Then, it fails as expected:
[component_container_isolated-1] [ERROR] [1677715634.550778659] [measurement_server]: Validation failed: At /time of 139123 - instance exceeds maximum of 0
[component_container_isolated-1] data={"tags":["flb_stdout"],"time":139123}
[component_container_isolated-1] [INFO] [1677715634.550911115] [measurement_server]: Callback! Validation failed for uptime custom
[component_container_isolated-1] [ERROR] [1677715639.550754853] [measurement_server]: Validation failed: At /time of 139128 - instance exceeds maximum of 0
[component_container_isolated-1] data={"tags":["flb_stdout"],"time":139128}
[component_container_isolated-1] [INFO] [1677715639.550867662] [measurement_server]: Callback! Validation failed for uptime custom
Concepts
There are a few key concepts that are really important to understand how DC operates.
ROS 2
ROS 2 is the core middleware used for DC. If you are unfamilar with this, please visit the ROS 2 documentation before continuing.
Fluent Bit
Fluent Bit is used in the backend for most plugins in DC. If you are unfamilar with this, please visit the Fluent Bit documentation
The DC destination ROS node starts it using the fluent bit C api and thus DC directly gets all benefits from it.
Fluent Bit configuration has been wrapped in this node and all its configuration parameters can be passed from the YAML configuration file.
Lifecycle Nodes and Bond
(Source: Nav2 documentation)
Lifecycle (or Managed, more correctly) nodes are unique to ROS 2. More information can be found here. They are nodes that contain state machine transitions for bringup and teardown of ROS 2 servers. This helps in deterministic behavior of ROS systems in startup and shutdown. It also helps users structure their programs in reasonable ways for commercial uses and debugging.
When a node is started, it is in the unconfigured state, only processing the node’s constructor which should not contain any ROS networking setup or parameter reading. By the launch system, or the supplied lifecycle manager, the nodes need to be transitioned to inactive by configuring. After, it is possible to activate the node by transitioning through the activating stage.
This state will allow the node to process information and be fully setup to run. The configuration stage, triggering the on_configure() method, will setup all parameters, ROS networking interfaces, and for safety systems, all dynamically allocated memory. The activation stage, triggering the on_activate() method, will active the ROS networking interfaces and set any states in the program to start processing information.
To shutdown, we transition into deactivating, cleaning up, shutting down and end in the finalized state. The networking interfaces are deactivated and stop processing, deallocate memory, exit cleanly, in those stages, respectively.
The lifecycle node framework is used extensively through out this project and all servers utilize it. It is best convention for all ROS systems to use lifecycle nodes if it is possible.
Within DC, we use a wrapper of LifecycleNodes, nav2_util LifecycleNode from Nav2. This wrapper wraps much of the complexities of LifecycleNodes for typical applications. It also includes a bond connection for the lifecycle manager to ensure that after a server transitions up, it also remains active. If a server crashes, it lets the lifecycle manager know and transition down the system to prevent a critical failure. See Eloquent to Foxy for details.
Measurements
Measurements are a single data unit presented in JSON format, that can contain different fields. For example, Memory measurement:
{
    "date": "2022-12-04T14:16:06.810999008",
    "memory": {
        "used": 76.007431
    },
}
Every incoming piece of data that belongs to a log or a metric that is retrieved by DC is considered an Event or Record.
Internally, when using Fluent Bit based plugins, it will contain 2 components: its timestamp and its message. For us, in DC, it will always be a JSON string sent in a ROS message of StringStamped type. This ROS message contains:
- header: ROS timestamp as std_msgs/Header
- data: JSON message as string
- group_key: a string used as a key for the new message when grouping multiple messages together
Tag(s)
Every measurement requires to have at least a tag configured (via the tags parameter) so it is sent to its destination(s). This tag corresponds to the name of the plugin you defined in the same configuration. It is then used in a later stage by the Router to decide which Filter or Output phase it must go through.
Example:
destination_server:
  ros__parameters:
    destination_plugins: ["flb_stdout"]
    flb_stdout: # Custom name for the plugin
      plugin: "dc_destinations/FlbStdout"
      inputs: ["/dc/measurement/string_stamped"]
measurement_server:
  ros__parameters:
    measurement_plugins: ["uptime"]
    uptime:
      plugin: "dc_measurements/Uptime"
      topic_output: "/dc/measurement/uptime"
      tags: ["flb_stdout"] # Match the plugin set in the destination_server
To manage the tags in DC, we pass the tags as parameter to each measurement and automatically use 2 Fluent Bit filters to assign the ROS message to a certain Fluent Bit output:
- rewrite_tag filter: Modify the message tag to the destination(s) configured
- lua filter: Take the flags received as a string containing a list and set the tags internally in Fluent Bit.
You can find th code in flb_destination.hpp
Match
Fluent Bit allows to deliver your collected and processed Events to one or multiple destinations, this is done through a routing phase. A Match represent a simple rule to select Events where its tags matches a defined rule.
Destinations
A destination is where the data will be sent: AWS S3, stdout, AWS Kinesis. It has the possibility to use outputs from fluentbit.
Conditions
A condition enables or disables one or multiple measurements to be published and thus collected. We could for example enable collecting camera images only when a robot is stopped.
Data collection for a measurement can be enabled if one of many conditions are activated, multiple conditions are activated or none.
Timestamp
The Timestamp represents the time when an Event was created. All events are converting the ROS now time to timestamps (UTC)
JSON Messages
In DC, all messages sent by measurements are a ROS message and the data string must be a JSON message.
"Robot_X:1.5, Robot_Y:1.8" # Not valid data string
"{'x': 1.5, 'y': 1.8}"     # Valid data string
JSON validation
Each record follows a JSON schema by default, it follows this specification document JSON Schema Validation.
Each measurement has its own JSON schema, which can be overwritten in a custom package or disabled.
Buffering and data persistence
Fluent Bit has its own buffering management, explained in its documentation. Data can be stored in Memory or/and filesystem.
By default, DC uses the memory buffering for a small amount of data (5M) and then uses filesystem buffering.
The configuration is printed when starting the destination server:
[destination_server-2] [2023/02/24 10:36:15] [ info] [storage] ver=1.3.0, type=memory+filesystem, sync=full, checksum=off, max_chunks_up=128
[destination_server-2] [2023/02/24 10:36:15] [ info] [input:ros2:ros2.0] storage_strategy='filesystem' (memory + filesystem)
[destination_server-2] [2023/02/24 10:36:15] [ info] [input:storage_backlog:storage_backlog.1] queue memory limit: 976.6K
This buffering ensures data will persist across reboots
Scheduling and Retries
DC inherits from Fluent Bit features of scheduling and retries. It can be configured in the destination node. More about it can be read on the Fluent Bit documentation
Data Pipeline
flowchart LR
    dc_bringup_launch["DC Bringup Launch"]
    yaml_param["YAML Parameter file"]
    ros_middleware["ROS middleware"]

    subgraph m_s["Measurement Server"]
        direction LR
        meas_node["Measurement Node"]
        measurement_plugins["Measurement plugins"]
        meas_topics_out["ROS Topics"]
    end

    subgraph d_s["Destination Server"]
        direction LR
        dest_node["Destination Node"]
        dest_plugins["Destination plugins"]
    end

    subgraph g_s["Group Server"]
        direction LR
        group_node["Group Node"]
        group_grouped_data["Grouped data"]
        group_topics_out["ROS Topics"]
    end

    subgraph flb["Fluent Bit"]
        direction LR
        flb_server["Fluent Bit Server"]
        flb_mem_buff["Memory buffer"]
        flb_storage_buff["Storage buffer"]
        flb_record["Record"]
        flb_ros2_plugin["ROS2 plugin"]
        flb_output["Outputs"]
    end

    dc_bringup_launch--2.starts-->meas_node
    dc_bringup_launch--3.starts-->dest_node
    dc_bringup_launch--4.starts-->group_node
    dc_bringup_launch--1.loads-->yaml_param

    meas_node--2.1.initializes-->measurement_plugins
    measurement_plugins--"2.2.publish to"-->meas_topics_out

    dest_node--3.1.starts-->flb_server
    dest_node--3.2.initializes-->dest_plugins
    dest_node--3.3.loads-->flb_ros2_plugin

    flb_ros2_plugin--"3.3.subscribes to"-->meas_topics_out
    flb_ros2_plugin--"3.3.subscribes to"-->group_topics_out
    group_node--"4.1.subscribes to"-->meas_topics_out
    group_node--4.2.generates-->group_grouped_data
    group_grouped_data--"4.3.publishes to"-->group_topics_out

    flb_ros2_plugin--3.4.generates-->flb_record
    flb_record--"3.5.stores in"-->flb_mem_buff
    flb_record--"3.7.stores in"-->flb_storage_buff
    flb_mem_buff--3.6.flushes-->flb_output
    flb_storage_buff--3.8.flushes-->flb_output

    group_topics_out--"4.4.sends to"-->ros_middleware
    meas_topics_out--"2.3.sends to"-->ros_middleware
    ros_middleware--"when data received, sends to"-->flb_ros2_plugin
The data flow precised in this flowchart summarizes how data moves:
- DC Bringup loads the yaml configuration file
- DC Bringup starts the measurement node
- Measurement plugins are loaded and data starts to be collected
- Each plugin publishes what it collected on a ROS topic
- DC Bringup starts the destination node
- Fluent Bit server is started: as soon as it receives records, it goes through filters and then is flushed to desired destinations
- Destination plugins are loaded
- ROS2 Fluent Bit plugin is loaded: it subscribes to measurement and group output topics
- Fluent Bit filters are initialized: it edits data received, modify the tags to match the desired output(s) and edit the timestamp field if required
- DC Bringup starts the group node
- Subscribes to measurement and group topics outputs
- When all measurements of a group are received, it groups the JSONs into a new one
- It publishes the grouped data on another topic
Measurements
Description
Measurements are a single data unit presented in JSON format, that can contain different fields. For example, Memory measurement:
{
    "date": "2022-12-04T14:16:06.810999008",
    "memory": {
        "used": 76.007431
    },
    "id": "3c70afdcb6f248f28f4c3980734064c5",
    "robot_name": "C3PO",
    "run_id": 358
}
Node parameters
The node starts the fluent bit engine and its ros2 plugin and enables data collection from ROS 2 topics. This plugin will subscribe to the configured ROS 2 topics and data will be collected by Fluent Bit to destinations enabled by the destination node. Each topic is configured in a measurement, which is loaded in this node with pluginlib. In addition, conditions are pluginlibs plugin also loaded dynamically. They are optional plugins that allow to collect on some conditions, e.g robot is moving.
| Parameter name | Description | Type(s) | Default |
|---|---|---|---|
| measurement_plugins | Name of the measurement plugins to load | list[str] | N/A (mandatory) |
| condition_plugins | Name of the condition plugins to load | list[str] | N/A (mandatory) |
| save_local_base_path | Path where files will be saved locally (e.g camera images). Expands $X to environment variables and =Y to custom string parameters | str | "$HOME/ros2/data/%Y/%M/%D/%H" |
| all_base_path | Path where files will be saved at their destination (S3, minio...). Expands $X to environment variables and =Y to custom string parameters | str | "" |
| custom_str_params_list | Custom strings to use in other parameters. They are also appended in the json sent to the destination | list[str] | N/A |
| custom_str_params.force_override | Override values if the keys are already present in the measurement. Applies to all and can be overridden by custom_str_params.<param_name>.force_override | bool | false |
| custom_str_params.<param_name>.name | Key to add in the serialized data | str | N/A (optional) |
| custom_str_params.<param_name>.value | Value to set for the key as a fixed string | str | N/A (optional) |
| custom_str_params.<param_name>.value_from_file | Path to a file containing the value to set | str | N/A (optional) |
| custom_str_params.<param_name>.force_override | Override value if the key is already present in the measurement | bool | false |
| run_id.enabled | Identify which run the robot is. A new one is generated at every start of the node. Uses either a counter or UUID | str | true |
| run_id.counter | Enable counter for the run_id | str | true |
| run_id.counter_path | Path to store the last run. It is expanded with environment variables id | str | "$HOME/run_id" |
| run_id.uuid | Generate a new run ID by using a random UUID | str | false |
Plugin parameters
Each measurement is collected through a node and has these configuration parameters:
| Parameter name | Description | Type(s) | Default |
|---|---|---|---|
| plugin | Name of the plugin to load | str | N/A (mandatory) |
| topic_output | Topic where result will be published | str | "/dc/measurement/<measurement_name>" |
| group_key | Value of the key used when grouped | str | N/A (mandatory) |
| debug | More verbose output | bool | false |
| polling_interval | Interval to which data is collected in milliseconds | int (>=100) | 1000 |
| init_collect | Collect when the node starts instead of waiting the first tick | bool | true |
| init_max_measurements | Collect a maximum of n measurements when starting the node (-1 = never, 0 = infinite) | int | 0 |
| condition_max_measurements | Collect a maximum of n measurements when conditions are activated (-1 = never, 0 = infinite) | int | 0 |
| enable_validator | Will validate the data against a JSON schema | bool | true |
| json_schema_path | Path to the JSON schema, ignored if empty string | str | N/A (optional) |
| tags | Tags used by Fluent Bit to do the matching to destinations | list[str] | N/A (mandatory) |
| remote_prefixes | Prefixes to apply to the paths when sending files to a destination | str | N/A (optional) |
| remote_keys | Used by some plugins to generate remote paths | list[str] | N/A (optional) |
| if_all_conditions | Collect only if all conditions are activated | list[str] | N/A (optional) |
| if_any_conditions | Collect if any conditions is activated | list[str] | N/A (optional) |
| if_none_conditions | Collect only if all conditions are not activated | list[str] | N/A (optional) |
| include_measurement_name | Include measurement name in the JSON data | bool | false |
| include_measurement_plugin | Include measurement plugin name in the JSON data | bool | false |
Available plugins:
| Name | Description |
|---|---|
| Camera | Camera images, images can be rotated and inspected to detect content in images. They are saved as files |
| Command velocity | Command velocity: navigation commands |
| CPU | CPU statistics |
| Distance traveled | Total distance traveled by the robot |
| Dummy | Dummy event, for testing and debugging |
| IP Camera | IP camera videos as files |
| Map | ROS map files (yaml and pgm) and metadata used by the robot to localize and navigate |
| Memory | System memory usage |
| Network | Network interfaces, availability |
| OS | Operating System information |
| Permissions | Permissions of a file or directory |
| Position | Robot position |
| Speed | Robot speed |
| Storage | Available and used space in a directory |
| String stamped | Republish a string stamped message, can be used for external data |
| TCP Health | Health status of a TCP Server |
| Uptime | How long the machine has been turned on |
Camera
Description
Save camera image files: raw, rotated and/or inspected. Images can be inspected using different services (e.g barcode detection)
Parameters
| Parameter | Description | Type | Default |
|---|---|---|---|
| cam_name | Name to give to the camera | str | N/A (mandatory) |
| cam_topic | Topic from where camera data needs to be fetched | str | N/A (mandatory) |
| detection_modules | Detection modules to use | list[str](barcode) | N/A (optional) |
| draw_det_barcodes | Draw barcode detection on images | bool | true |
| rotation_angle | Rotate the image before inspecting it by this angle | int (90, 180, 270) | 0 |
| save_detections_img | Whether to save inspected image captured by the camera with detection shapes | bool | true |
| save_inspected_base64 | Whether to save inspected image captured by the camera with detection shapes as base64 string | bool | false |
| save_inspected_path | Path to save the inspected camera image. Expands environment variables and datetime format are expanded | str | "camera/inspected/%Y-%m-%dT%H:%M:%S" |
| save_raw_base64 | Whether to save raw image captured by the camera as base64 string | bool | false |
| save_raw_img | Whether to save raw image captured by the camera | bool | false |
| save_raw_path | Path to save the raw camera image. Expands environment variables and datetime | str | "camera/raw/%Y-%m-%dT%H:%M:%S" |
| save_rotated_base64 | Whether to save rotated image captured by the camera as base64 string | bool | false |
| save_rotated_img | Whether to save rotated image captured by the camera | bool | false |
| save_rotated_path | Path to save the rotated camera image. Expands environment variables and datetime format are expanded | str | "camera/rotated/%Y-%m-%dT%H:%M:%S" |
Measurement node configuration
The remote paths are also saved in the JSON under <measurement_name>.
Note that this remote key is not included in the JSON schema, which only contains the local paths. If you want to enforce the schema with your custom remote key, you will need to write it and load it manually.
...
camera:
  plugin: "dc_measurements/Camera"
  group_key: "camera_with_codes"
  topic_output: "/dc/measurement/camera_with_codes"
  polling_interval: 10000
  init_collect: true
  node_name: "dc_measurement_camera"
  cam_topic: "/camera_with_codes"
  cam_name: my_camera_with_codes
  enable_validator: false
  draw_det_barcodes: true
  save_raw_img: true
  save_rotated_img: false
  save_detections_img: true
  save_raw_path: "camera_with_codes/raw/%Y-%m-%dT%H-%M-%S"
  save_rotated_path: "camera_with_codes/rotated/%Y-%m-%dT%H-%M-%S"
  save_inspected_path: "camera_with_codes/inspected/%Y-%m-%dT%H-%M-%S"
  rotation_angle: 0
  detection_modules: ["barcode"]
  remote_prefixes: [""]
  remote_keys: ["minio"] # Will create paths for Minio, does not send the file
Destination node configuration
Now that the path is set, it can be used to know where to send the image:
...
flb_minio:
  verbose_plugin: false
  time_format: "iso8601"
  plugin: "dc_destinations/FlbMinIO"
  inputs: ["/dc/group/cameras"]
  endpoint: 127.0.0.1:9000
  access_key_id: XEYqG4ZcPY5jiq5i
  secret_access_key: ji011KCtI82ZeQS6UwsQAg8x9VR4lSaQ
  use_ssl: false
  create_bucket: true
  bucket: "mybucket"
  src_fields:
    [
      "camera.local_img_paths.raw",
      "camera.local_img_paths.inspected"
    ]
  upload_fields: # Remote paths created by the measurement node configuration
    [
      "camera.minio_img_paths.raw",
      "camera.minio_img_paths.inspected"
    ]
...
Schema
{
  "$schema":"http://json-schema.org/draft-07/schema#",
  "title":"Camera",
  "description":"Camera images with detected objects",
  "properties":{
    "camera_name": {
      "description": "Name of the camera",
      "type": "string"
    },
    "local_img_paths":{
      "description":"Paths of saved images",
      "type":"object",
      "items":{
        "$ref":"#/$defs/local_img_paths"
      }
    },
    "inspected":{
      "description":"Inspected content of an image",
      "type":"object",
      "items":{
        "$ref":"#/$defs/inspected"
      }
    }
  },
  "$defs":{
    "local_img_paths":{
      "type":"object",
      "properties":{
        "raw":{
          "description":"Raw image",
          "type":"string"
        },
        "rotated":{
          "description":"Rotated image",
          "type":"string"
        },
        "inspected":{
          "description":"Inspected image",
          "type":"string"
        }
      }
    },
    "inspected":{
      "type":"object",
      "properties":{
        "barcode":{
          "description":"Barcode inspected data",
          "type":"array",
          "items":{
            "$ref":"#/$defs/barcode"
          }
        }
      }
    },
    "barcode":{
      "type":"object",
      "properties":{
        "data":{
          "description":"Barcode data",
          "type":"array",
          "items":{
            "type":"integer"
          }
        },
        "height":{
          "description":"Barcode height",
          "type":"integer"
        },
        "width":{
          "description":"Barcode width",
          "type":"integer"
        },
        "top":{
          "description":"Barcode top position",
          "type":"integer"
        },
        "left":{
          "description":"Barcode left position",
          "type":"integer"
        },
        "type":{
          "description":"Barcode type",
          "type":"string"
        }
      }
    }
  },
  "type":"object"
}
Cmd_vel
Description
Collect command velocity sent to the robot by subscribing to cmd_vel topic.
Parameters
| Parameter | Description | Type | Default |
|---|---|---|---|
| topic | Topic to subscribe to to get the cmd_vel (geometry_msgs/Twist) | str | "/cmd_vel" |
Schema
{
    "$schema": "http://json-schema.org/draft-07/schema#",
    "title": "Cmd_vel",
    "description": "Command velocity sent to the robot",
    "properties": {
        "computed": {
            "description": "Computed command velocity in meter/s",
            "type": "number"
        },
        "linear": {
            "description": "Linear velocity as a vector",
            "type": "object",
            "items": {
                "$ref": "#/$defs/vector3"
            }
        },
        "angular": {
            "description": "Angular velocity as a vector",
            "type": "object",
            "items": {
                "$ref": "#/$defs/vector3"
            }
        }
    },
    "$defs": {
        "vector3": {
            "type": "object",
            "properties": {
                "x": {
                    "description": "X speed",
                    "type": "number"
                },
                "y": {
                    "description": "Y speed",
                    "type": "number"
                },
                "z": {
                    "description": "Z speed",
                    "type": "number"
                }
            }
        }
    },
    "type": "object"
}
Measurement configuration
...
cmd_vel:
  plugin: "dc_measurements/CmdVel"
  group_key: "cmd_vel"
  topic_output: "/dc/measurement/cmd_vel"
CPU
Description
Collect cpu usage: average cpu, number of processes running and processes sorted by cpu usage.
Parameters
| Parameter | Description | Type | Default |
|---|---|---|---|
| cpu_min | Filters out processes using less than this cpu usage. -1 to disable | float | 5.0 |
| max_processes | Max amount of processes to collect in the sorted field. -1 for all | int | 5 |
Schema
{
    "$schema": "http://json-schema.org/draft-07/schema#",
    "title": "Cpu",
    "description": "CPU statistics",
    "properties": {
        "average": {
            "description": "Average CPU",
            "type": "number",
            "minimum": 0
        },
        "processes": {
            "description": "Number of processes running",
            "type": "integer",
            "minimum": 0
        },
        "sorted": {
            "description": "Processes sorted by CPU usage",
            "type": "array",
            "items": {
                "$ref": "#/$defs/process"
            }
        }
    },
    "$defs": {
        "process": {
            "type": "object",
            "description": "Process information",
            "properties": {
                "pid": {
                    "description": "Process ID of the process",
                    "type": "integer"
                },
                "user": {
                    "description": "User who started the process",
                    "type": "string"
                },
                "cmd": {
                    "description": "Command that launched the process",
                    "type": "string"
                },
                "cpu": {
                    "description": "Process' current utilization as a percentage of total CPU time",
                    "type": "number"
                },
                "ram": {
                    "description": "Memory in use by this process in kb",
                    "type": "integer"
                },
                "uptime": {
                    "description": "Age of the process in seconds",
                    "type": "integer"
                }
            }
        }
    },
    "type": "object"
}
Measurement configuration
...
cpu:
  plugin: "dc_measurements/Cpu"
  topic_output: "/dc/measurement/cpu"
  tags: ["flb_stdout"]
  max_processes: 10
  cpu_min: 10.0
Dummy
Description
The dummy measurement, generates dummy events. It is useful for testing, debugging, benchmarking and getting started with ROS 2 Data collection.
Parameters
| Parameter | Description | Type | Default |
|---|---|---|---|
| record | Dummy JSON record. | str | "{"message":"Hello from ROS 2 DC"}" |
Schema
{
    "$schema": "http://json-schema.org/draft-07/schema#",
    "title": "Dummy",
    "description": "Dummy JSON",
    "properties": {
        "message": {
            "description": "Dummy message",
            "type": "string"
        }
    },
    "type": "object"
}
Measurement configuration
...
dummy:
  plugin: "dc_measurements/Dummy"
  topic_output: "/dc/measurement/dummy"
  tags: ["flb_stdout"]
Distance traveled
Description
Collect total distance traveled in the robot since it is powered.
Parameters
| Parameter | Description | Type | Default |
|---|---|---|---|
| global_frame | Global frame | str | "map" |
| robot_base_frame | Robot base frame | str | "base_link" |
| transform_timeout | TF Timeout to use for transformation | float | 0.1 |
Schema
{
    "$schema": "http://json-schema.org/draft-07/schema#",
    "title": "Distance traveled",
    "description": "Total distance traveled in meters by the robot",
    "properties": {
        "distance_traveled": {
            "description": "Total distance traveled in meters",
            "type": "number"
        }
    },
    "type": "object"
}
Measurement configuration
...
distance_traveled:
  plugin: "dc_measurements/DistanceTraveled"
  topic_output: "/dc/measurement/distance_traveled"
  tags: ["flb_stdout"]
  global_frame: "map"
  robot_base_frame: "base_link"
  transform_timeout: 0.1
Ip Camera
Description
Records video in small segments (in case of a cut) and store it locally. They are first stored in a temporary folder. Once the record (of e.g 10 seconds) is done, it is moved to another directory.
Compared to other plugins, the collect function only moves the files from the temporary location, it does not start the recording. It takes some time to establish connection, so we avoid doing this every time. Recording is started at initialization by an ffmpeg process and saved in HLS format.
Parameters
| Parameter | Description | Type | Default |
|---|---|---|---|
| input | Input url | str | N/A (Mandatory) |
| video | Enable video recording | bool | true |
| audio | Enable audio recording | bool | false |
| bitrate_video | Video bitrate | str([0-9]+[kmKM]) | "2M" |
| bitrate_audio | Audio bitrate | str([0-9]+[kmKM]) | "192k" |
| segment | Records by small segment, managed by ffmpeg | bool | bool |
| segment_time | Duration of a segment | int (>0) | 10 |
| ffmpeg_log_level | Ffmpeg log level | str (See doc) | "info" |
| ffmpeg_banner | Show ffmpeg banner in console | bool | true |
| save_path | Path used to save files with ffmpeg, UTC date is used. There can't be ":" in this string, ffmpeg does not parse it | str | "ffmpeg_%Y-%m-%dT%H:%M:%S" |
Schema
{
    "$schema": "http://json-schema.org/draft-07/schema#",
    "title": "Ip Camera",
    "description": "Local and remote path where the remote camera video is recorded",
    "properties": {
        "local_path": {
            "description": "Local video path",
            "type": "string"
        },
        "remote_path": {
            "description": "Remote video path",
            "type": "string"
        }
    },
    "type": "object"
}
Map
Description
Save map using nav2_map_server and collect the map of the local map saved. The measurement also includes metadata: width, height and x and y origin.
Parameters
| Parameter | Description | Type | Default |
|---|---|---|---|
| quiet | Disable stdout for nav2 map saver | bool | true |
| save_path | Path to save the map to. Environment variables and datetime format are expanded | str | "map/%Y-%m-%dT%H:%M:%S" |
| save_map_timeout | Time to wait to save the map | float | 3.0 |
| topic | Topic to subscribe to to get the map | str | "/map" |
Schema
{
    "$schema": "http://json-schema.org/draft-07/schema#",
    "title": "Map",
    "description": "Map saved metadata and paths",
    "properties": {
        "resolution": {
            "description": "Resolution of the map, meters/pixel",
            "type": "number",
            "minimum": 0
        },
        "local_paths": {
            "description": "Paths where metadata and image are stored",
            "type": "object",
            "items": {
                "$ref": "#/$defs/paths"
            }
        },
        "origin": {
            "description": "Robot origin position in meters",
            "type": "object",
            "items": {
                "$ref": "#/$defs/origin"
            }
        },
        "width": {
            "description": "Width of the PGM",
            "type": "integer",
            "minimum": 0
        },
        "height": {
            "description": "Height of the PGM",
            "type": "integer",
            "minimum": 0
        }
    },
    "$defs": {
        "origin": {
            "type": "object",
            "description": "The 2-D pose of the lower-left pixel in the map, as (x, y, yaw), with yaw as counterclockwise rotation (yaw=0 means no rotation). Many parts of the system currently ignore yaw.",
            "properties": {
                "x": {
                    "description": "X origin of the robot",
                    "type": "number"
                },
                "y": {
                    "description": "Y origin of the robot",
                    "type": "number"
                }
            }
        },
        "paths": {
            "type": "object",
            "properties": {
                "png": {
                    "description": "Path to the map PNG file containing the image",
                    "type": "string"
                },
                "yaml": {
                    "description": "Path to the map YAML file containing map metadata",
                    "type": "string"
                },
                "pgm": {
                    "description": "Path to the map PGM file containing the gray-scale image",
                    "type": "string"
                }
            }
        }
    },
    "type": "object"
}
Measurement configuration
...
map:
  plugin: "dc_measurements/Map"
  topic_output: "/dc/measurement/map"
  tags: ["flb_stdout"]
  topic: "/map"
  save_map: "map/%Y-%m-%dT%H:%M:%S"
  save_map_timeout: 0.2
  quiet: true
  remote_keys: ["s3"]
Memory
Description
Collect memory used in percentage.
Schema
{
    "$schema": "http://json-schema.org/draft-07/schema#",
    "title": "Memory",
    "description": "Memory used",
    "properties": {
        "used": {
            "description": "Memory used in percent",
            "type": "number",
            "minimum": 0
        }
    },
    "type": "object"
}
Measurement configuration
...
memory:
  plugin: "dc_measurements/Memory"
  topic_output: "/dc/measurement/memory"
  tags: ["flb_stdout"]
Network
Description
Collects ping value, whether or not the PC is online and interfaces available.
Parameters
| Parameter | Description | Type | Default |
|---|---|---|---|
| ping_address | IP address to test the ping to | str | "8.8.8.8" |
| ping_timeout | Time in ms before ping times out. Offline if superior to it | int | 5000 |
Schema
{
    "$schema": "http://json-schema.org/draft-07/schema#",
    "title": "Network",
    "description": "Network accessibility and information",
    "properties": {
        "ping": {
            "description": "Time to ping the host in ms",
            "type": "integer",
            "minimum": -1
        },
        "online": {
            "description": "If the pc is online",
            "type": "boolean"
        },
        "interfaces": {
            "description": "List of network interfaces",
            "type": "array",
            "items": {
                "type": "string"
            }
        }
    },
    "type": "object"
}
Measurement configuration
...
network:
  plugin: "dc_measurements/Network"
  topic_output: "/dc/measurement/network"
  tags: ["flb_stdout"]
  ping_address: 192.168.0.1
  ping_timeout: 500
OS
Description
Collects the Operating System information: cpus, operating system name and kernel information
Schema
{
  "$schema": "http://json-schema.org/draft-07/schema#",
  "title": "OS",
  "description": "OS, kernel and CPUs information",
  "properties": {
    "os": {
      "description": "Host distribution name",
      "type": "string"
    },
    "kernel": {
      "description": "Kernel version",
      "type": "string"
    },
    "cpu": {
      "description": "Number of CPUs",
      "type": "integer",
      "minimum": 0
    },
    "memory": {
      "description": "System memory",
      "type": "number",
      "minimum": 0
    }
  },
  "type": "object"
}
Measurement configuration
...
os:
  plugin: "dc_measurements/OS"
  topic_output: "/dc/measurement/os"
  tags: ["flb_stdout"]
Permissions
Description
Collect UID, GID, if a file or directory exists and its permissions (in rwx or integer format).
Parameters
| Parameter | Description | Type | Default |
|---|---|---|---|
| format | Format to collect permissions in | str(rwx or int) | "int" |
| path | Path to the file or directory to collect data from, support environment variables | str | N/A (mandatory) |
Schemas
{
    "$schema": "http://json-schema.org/draft-07/schema#",
    "title": "Permissions",
    "description": "Permissions of a file/directory",
    "properties": {
        "uid": {
            "description": "File/directory User IDentifier",
            "type": "integer"
        },
        "gid": {
            "description": "File/directory Group IDentifier",
            "type": "integer"
        },
        "exists": {
            "description": "File/directory exists",
            "type": "boolean"
        },
        "permissions": {
            "description": "Permissions as rwx or integer",
            "type": "string"
        }
    },
    "type": "object"
}
Measurement configuration
...
permission_home_dc:
  plugin: "dc_measurements/Permissions"
  topic_output: "/dc/measurement/permissions_home_dc"
  tags: ["flb_stdout"]
  path: "$HOME/dc"
  format: "rwx"
Position
Description
Collect x, y and yaw of the robot.
Parameters
| Parameter | Description | Type | Default |
|---|---|---|---|
| global_frame | Global frame | str | "map" |
| robot_base_frame | Robot base frame | str | "base_link" |
| transform_timeout | TF Timeout to use for transformation | float | 0.1 |
Schema
{
    "$schema": "http://json-schema.org/draft-07/schema#",
    "title": "Position",
    "description": "Position and orientation of the robot",
    "properties": {
        "x": {
            "description": "X position of the robot",
            "type": "number"
        },
        "y": {
            "description": "Y position of the robot",
            "type": "number"
        },
        "yaw": {
            "description": "Yaw angle of the robot",
            "type": "number"
        }
    },
    "type": "object"
}
Measurement configuration
...
position:
  plugin: "dc_measurements/Position"
  topic_output: "/dc/measurement/position"
  tags: ["flb_stdout"]
Speed
Description
Collect robot speed using the Odom topic.
Parameters
| Parameter | Description | Type | Default |
|---|---|---|---|
| odom_topic | Topic to subscribe to to get the odometry (nav_msgs/Odometry) | str | "/odom" |
Schema
{
    "$schema": "http://json-schema.org/draft-07/schema#",
    "title": "Speed",
    "description": "Computed, linear and angular speed of the robot",
    "properties": {
        "computed": {
            "description": "Computed speed in meter/s",
            "type": "number"
        },
        "linear": {
            "description": "Linear velocity as a vector",
            "type": "object",
            "items": {
                "$ref": "#/$defs/vector3"
            }
        },
        "angular": {
            "description": "Angular velocity as a vector",
            "type": "object",
            "items": {
                "$ref": "#/$defs/vector3"
            }
        }
    },
    "$defs": {
        "vector3": {
            "type": "object",
            "properties": {
                "x": {
                    "description": "X speed",
                    "type": "number"
                },
                "y": {
                    "description": "Y speed",
                    "type": "number"
                },
                "z": {
                    "description": "Z speed",
                    "type": "number"
                }
            }
        }
    },
    "type": "object"
}
Measurement configuration
...
speed:
  plugin: "dc_measurements/Speed"
  topic_output: "/dc/measurement/speed"
  tags: ["flb_stdout"]
  odom_topic: "/odom"
Storage
Description
Collect storage information on a directory.
Parameters
| Parameter | Description | Type | Default |
|---|---|---|---|
| path | Absolute path to the directory to inspect, expect environment variables | str | N/A (Mandatory) |
Schema
{
    "$schema": "http://json-schema.org/draft-07/schema#",
    "title": "Storage",
    "description": "Storage information of a directory",
    "properties": {
        "free_percent": {
            "description": "Free space on the filesystem, in percent",
            "type": "number",
            "minimum": 0
        },
        "free": {
            "description": "Free space on the filesystem, in bytes",
            "type": "integer",
            "minimum": 0
        },
        "capacity": {
            "description": "Total size of the filesystem, in bytes",
            "type": "integer",
            "minimum": 0
        }
    },
    "type": "object"
}
Measurement configuration
...
storage_home:
  plugin: "dc_measurements/Storage"
  topic_output: "/dc/measurement/storage_home"
  tags: ["flb_stdout"]
  path: "$HOME"
String stamped
Description
Collect generic data from a topic publishing a StringStamped message and republish it. It allows to fetch data from rclc, rclpy and your custom ROS 2 nodes that don't have use a plugin.
Parameters
| Parameter | Description | Type | Default |
|---|---|---|---|
| timer_based | If true, collect data at interval and if false collect every record and ignores polling_interval | bool | true |
| topic | Topic to get data from | str | N/A (mandatory) |
Schema
Given that the data is customized here, there is no default schema.
Measurement configuration
...
my_data:
  plugin: "dc_measurements/StringStamped"
  topic_output: "/dc/measurement/my_data"
  tags: ["flb_stdout"]
  topic: "/hello-world"
  timer_based: true
TCP Health
Description
Collects status of a TCP server.
Parameters
| Parameter | Description | Type | Default |
|---|---|---|---|
| name | Alias to give to the TCP Server | str | N/A (Mandatory) |
| host | Name of the target host or IP address to check | str | "127.0.0.1" (Optional) |
| port | TCP port where to perform the connection check. | int(>0 <65536) | 80 (Optional) |
Schema
{
    "$schema": "http://json-schema.org/draft-07/schema#",
    "title": "TCP Health",
    "description": "Status of a TCP server",
    "properties": {
        "host": {
            "description": "Server hostname",
            "type": "string"
        },
        "port": {
            "description": "Port number",
            "type": "integer",
            "minimum": 1,
            "maximum": 65536
        },
        "server_name": {
            "description": "Time the system has been up",
            "type": "string"
        }
    },
    "type": "object"
}
Measurement configuration
...
tcp_health:
  plugin: "dc_measurements/TCPHealth"
  topic_output: "/dc/measurement/minio_health"
  group_key: "minio_health"
  tags: ["flb_stdout"]
  host: "127.0.0.1"
  port: 9000
  name: "minio_api"
Uptime
Description
Time since when the robot PC has been on.
Schema
{
    "$schema": "http://json-schema.org/draft-07/schema#",
    "title": "Uptime",
    "description": "Time the system has been up",
    "properties": {
        "time": {
            "description": "Time the system has been up",
            "type": "integer",
            "minimum": 0
        }
    },
    "type": "object"
}
Measurement configuration
...
uptime:
  plugin: "dc_measurements/Uptime"
  topic_output: "/dc/measurement/uptime"
  tags: ["flb_stdout"]
Overview
Description
A condition enables or disables one or multiple measurements to be published and thus collected. We could for example enable collecting camera images only when a robot is stopped:
Each condition is enabled or disabled through a pluginlib plugin. It has these configuration parameters:
Available plugins:
| Name | Description |
|---|---|
| Robot moving | Robot is moving |
| Bool equal | Value of a boolean key is equal to |
| Double equal | Value of a double key is equal to |
| Double inferior | Value of a double key is inferior to |
| Double superior | Value of a double key is superior to |
| Exist | Key exists |
| Integer equal | Value of an integer key is equal to |
| Integer inferior | Value of an integer key is inferior to |
| Integer superior | Value of an integer key is superior to |
| List bool equal | Value of a list of boolean key is equal to |
| List double equal | Value of a list of double key is equal to |
| List integer equal | Value of a list of integer key is equal to |
| List string equal | Value of a list of string key is equal to |
| Same as previous | Value of the key is the same as the previous one |
| String match | Value of a string key matches the regex of |
Bool equal
Description
Compare JSON key value to the value passed in parameter and returns true if equal.
Parameters
| Parameter | Description | Type | Default |
|---|---|---|---|
| key | JSON key where value is located, separate nested dictionary with / | str | N/A (Mandatory) |
| value | Value to which compare the JSON value | bool | N/A (Mandatory) |
Double equal
Description
Compare JSON key value to the value passed in parameter and returns true if equal.
Parameters
| Parameter | Description | Type | Default |
|---|---|---|---|
| key | JSON key where value is located, separate nested dictionary with / | str | N/A (Mandatory) |
| value | Value to which compare the JSON value | float | N/A (Mandatory) |
Double inferior
Description
Compare JSON key value to the value passed in parameter and returns true if inferior.
Parameters
| Parameter | Description | Type | Default |
|---|---|---|---|
| key | JSON key where value is located, separate nested dictionary with / | str | N/A (Mandatory) |
| value | Value to which compare the JSON value | float | N/A (Mandatory) |
Double superior
Description
Compare JSON key value to the value passed in parameter and returns true if superior.
Parameters
| Parameter | Description | Type | Default |
|---|---|---|---|
| key | JSON key where value is located, separate nested dictionary with / | str | N/A (Mandatory) |
| value | Value to which compare the JSON value | float | N/A (Mandatory) |
Exist
Description
Compare JSON key value to the value passed in parameter and returns true if exists.
Parameters
| Parameter | Description | Type | Default |
|---|---|---|---|
| key | JSON key where value is located, separate nested dictionary with / | str | N/A (Mandatory) |
Integer equal
Description
Compare JSON key value to the value passed in parameter and returns true if equal.
Parameters
| Parameter | Description | Type | Default |
|---|---|---|---|
| key | JSON key where value is located, separate nested dictionary with / | str | N/A (Mandatory) |
| value | Value to which compare the JSON value | int | N/A (Mandatory) |
Integer inferior
Description
Compare JSON key value to the value passed in parameter and returns true if inferior.
Parameters
| Parameter | Description | Type | Default |
|---|---|---|---|
| key | JSON key where value is located, separate nested dictionary with / | str | N/A (Mandatory) |
| value | Value to which compare the JSON value | int | N/A (Mandatory) |
Integer superior
Description
Compare JSON key value to the value passed in parameter and returns true if superior.
Parameters
| Parameter | Description | Type | Default |
|---|---|---|---|
| key | JSON key where value is located, separate nested dictionary with / | str | N/A (Mandatory) |
| value | Value to which compare the JSON value | int | N/A (Mandatory) |
List bool equal
Description
Compare JSON key value to the value passed in parameter and returns true if equal.
Parameters
| Parameter | Description | Type | Default |
|---|---|---|---|
| key | JSON key where value is located, separate nested dictionary with / | str | N/A (Mandatory) |
| value | Value to which compare the JSON value | bool | N/A (Mandatory) |
| order_matters | If true, will compare taking account of the order | bool | true |
List double equal
Description
Compare JSON key value to the value passed in parameter and returns true if equal.
Parameters
| Parameter | Description | Type | Default |
|---|---|---|---|
| key | JSON key where value is located, separate nested dictionary with / | str | N/A (Mandatory) |
| value | Value to which compare the JSON value | list[float] | N/A (Mandatory) |
| order_matters | If true, will compare taking account of the order | bool | true |
List integer equal
Description
Compare JSON key value to the value passed in parameter and returns true if equal.
Parameters
| Parameter | Description | Type | Default |
|---|---|---|---|
| key | JSON key where value is located, separate nested dictionary with / | str | N/A (Mandatory) |
| value | Value to which compare the JSON value | list[int] | N/A (Mandatory) |
| order_matters | If true, will compare taking account of the order | bool | true |
List string equal
Description
Compare JSON key value to the value passed in parameter and returns true if equal.
Parameters
| Parameter | Description | Type | Default |
|---|---|---|---|
| key | JSON key where value is located, separate nested dictionary with / | str | N/A (Mandatory) |
| value | Value to which compare the JSON value | bool | N/A (Mandatory) |
| order_matters | If true, will compare taking account of the order | bool | true |
Moving
Description
Use a hysteresis on robot position to know whether the robot is moving.
Parameters
| Parameter | Description | Type | Default |
|---|---|---|---|
| odom_topic | Topic from where odom is used to know if the robot is moving | str | "/odom" |
| speed_threshold | Speed threshold used in the hysteresis | float | 0.2 |
| count_limit | Counter to know if the robot is moving | int | 8 |
| count_hysteresis | Hysteresis counter | int | 5 |
Same as previous
Description
Compare JSON key value to the value passed in parameter and returns true if match.
Parameters
| Parameter | Description | Type | Default |
|---|---|---|---|
| keys | JSON keys where values are located, separate nested dictionary with / | list[str] | N/A (Mandatory) |
| exclude | JSON keys to exclude in comparison | list[str] | N/A (Mandatory) |
String match
Description
Compare JSON key value to the value passed in parameter and returns true if match.
Parameters
| Parameter | Description | Type | Default |
|---|---|---|---|
| key | JSON key where value is located, separate nested dictionary with / | str | N/A (Mandatory) |
| regex | Regex to which compare the JSON value to | str | N/A (Mandatory) |
Data validation
Model
Each measurement cam validate its data with a model.
We use use JSON schema validator for JSON for Modern C++.
Schemas follow the JSON 7 model:
{
    "$schema": "http://json-schema.org/draft-07/schema#",
    "title": "Uptime",
    "description": "Time the system has been up",
    "properties": {
        "time": {
            "description": "Time the system has been up",
            "type": "integer",
            "minimum": 0
        }
    },
    "type": "object"
}
It is possible to enforce the validation. By default, it is disabled since some fields can be filtered out, and some are added dynamically (e.g remote paths).
Currently it is not possible to select another schema but it is planned to be able to pass a custom path later on.
Failed validation callback
You might want to trigger some actions when a validation fails, e.g send the data to another database to later on debug it.
In this case, you will need to write your own plugin (inherit from an existing one or start from scratch) and define the onFailedValidation function in the class.
This case is covered by the custom plugin demo
Use a different Schema
For each plugin, a default path is provided but this can be changed by passing the json_schema_path parameter in the measurement plugin parameter to the absolute path of your schema.
Groups
Description
Each measurement is part of a group. This allows measurements to be grouped together later on. For example, having the measurements cpu and position belonging to the same group, data will be published together on /dc/group/my_group
{
    "cpu": ...,
    "position": ...,
}
Currently, this node is written in python. The main reason for it is that we don't know how to allocate and pass different amount of variables to the TimeSynchronizer. In python it is quite simple, but not so in C++.
Node parameters
| Parameter | Description | Type | Default |
|---|---|---|---|
| groups | Groups to enable | list[str] | N/A |
Group parameters
| Parameter | Description | Type | Default |
|---|---|---|---|
| inputs | Name of the input topics to group | list[str] | N/A |
| output | Output topic to send the data to | str | "/dc/group/{group}" |
| sync_delay | Delay to wait during all subscriber data need to reach before being published again | float | 5.0 |
| group_key | Dictionary key under which data is grouped | str | {group_name} |
| exclude_keys | List of keys to exclude from the published data. Data depth is separated by a dot | list[str] | N/A |
| tags | Destination names, used to know where data will be forwarded to | list[str] | N/A |
| nested_data | Whether measurements are nested dictionaries or flat | bool | false |
| include_group_name | Include group name in the JSON as key="name" and value=<group_key> | bool | true |
Example
group_server:
  ros__parameters:
    groups: ["map", "memory_uptime"]
    memory_cpu:
      inputs: ["/dc/measurement/memory", "/dc/measurement/cpu"]
      output: "/dc/group/memory_cpu"
      sync_delay: 5.0
      group_key: "memory_cpu"
      tags: ["flb_pgsql"]
    memory_uptime:
      inputs: ["/dc/measurement/memory", "/dc/measurement/uptime"]
      output: "/dc/group/memory_uptime"
      sync_delay: 5.0
      group_key: "memory_uptime"
      tags: ["flb_stdout"]
    cameras:
      inputs: ["/dc/measurement/camera"]
      output: "/dc/group/cameras"
      sync_delay: 5.0
      group_key: "cameras"
      tags: ["flb_minio", "flb_stdout"]
    map:
      inputs: ["/dc/measurement/map"]
      output: "/dc/group/map"
      sync_delay: 5.0
      group_key: "map"
      tags: ["flb_minio", "flb_stdout"]
Overview
Description
A destination is where the data will be sent: AWS S3, stdout, AWS Kinesis. It has the possibility to use outputs from fluentbit.
The destination node is similar to the measurement one. It:
- Either subscribes to data in the main node and data is forwarded with ros based destination plugins
- Either subscribes to data from the ros2 fluent bit plugin.
The fluent bit plugin is the preferred one since when using it, we get all the benefits from fluent bit (especially data integrity). The ros2 fluent bit plugin uses rclc and is at the moment a fork of fluent bit. It could also be rewritten as a fluent bit plugin based on the GO interface, but pros and cons to move to it are not clear yet.
Node parameters
Destinations parameters are loaded dynamically. Here are the static ones:
| Parameter name | Description | Type(s) | Default |
|---|---|---|---|
| flb.flush | Interval to flush output (seconds) | str | "1" |
| flb.grace | Wait time (seconds) on exit | str | "1" |
| flb.log_level | Diagnostic level (error/warning/info/debug/trace) | str | "info" |
| flb.storage_path | Set an optional location in the file system to store streams and chunks of data. If this parameter is not set, Input plugins can only use in-memory buffering. | str | "/var/log/flb-storage/" |
| flb.storage_sync | Configure the synchronization mode used to store the data into the file system. It can take the values normal or full. | str | "normal" |
| flb.storage_checksum | Enable the data integrity check when writing and reading data from the filesystem. The storage layer uses the CRC32 algorithm. | str | "off" |
| flb.storage_backlog_mem_limit | If storage.path is set, Fluent Bit will look for data chunks that were not delivered and are still in the storage layer, these are called backlog data. This option configure a hint of maximum value of memory to use when processing these records. | str | "5M" |
| flb.scheduler_cap | Set a maximum retry time in seconds. The property is supported from v1.8.7. | str | "2000" |
| flb.scheduler_base | Set a base of exponential backoff. The property is supported from v1.8.7. | str | "5" |
| flb.http_server | If true enable statistics HTTP server | bool | false |
| flb.in_storage_type | Specifies the buffering mechanism to use. It can be memory or filesystem. | str | "filesystem" |
| flb.in_storage_pause_on_chunks_overlimit | Specifies if file storage is to be paused when reaching the chunk limit. | str | "off" |
Plugin parameters
| Parameter name | Description | Type(s) | Default |
|---|---|---|---|
| plugin | Plugin to load | list[str] | N/A |
| inputs | Topics to which to listen to get the data | list[str] | N/A |
| debug | Enable debug print | bool | false |
| time_format | Format the data will be printed | str("double", "iso8601") | "double" |
| time_key | Dictionary key from which date will be taken from | str | "date" |
Available plugins:
| Name | Description | Source |
|---|---|---|
| flb_file | Write the data received through the input plugin to file. | Fluent Bit File |
| flb_files_metrics | Ingest your records into the AWS Kinesis service | This project, in fluent_bit_plugins |
| flb_http | JSON to http request via Fluent Bit | Fluent Bit HTTP |
| flb_kinesis_streams | JSON to AWS Kinesis Streams via Fluent Bit | Amazon Kinesis Data Streams |
| flb_minio | JSON to Minio via Fluent Bit | This project, in fluent_bit_plugins package |
| flb_pgsql | JSON to PostgreSQL via Fluent Bit | Fluent Bit PostgreSQL |
| flb_stdout | JSON to STDOUT via Fluent Bit | Fluent Bit Stdout |
| flb_s3 | JSON to AWS S3 via Fluent Bit | Fluent Bit S3 |
| flb_tcp | JSON to TCP via Fluent Bit | Fluent Bit TCP & TLS |
| rcl | JSON to RCL | ROS 2 logging |
Example configuration
destination_server:
  ros__parameters:
    flb:
      flush: "1"
      flb_grace: "1"
      log_level: "info"
      storage_path: "/var/log/flb-storage/"
      storage_sync: "full"
      storage_checksum: "off"
      storage_backlog_mem_limit: "1M"
      scheduler_cap: "2000"
      scheduler_base: "5"
      metrics: true
      in_storage_type: "filesystem"
      in_storage_pause_on_chunks_overlimit: "off"
    destination_plugins: ["flb_stdout"]
    flb_minio:
      plugin: "dc_destinations/FlbMinIO"
      inputs: ["/dc/group/map"]
      plugin_path: "/root/ws/src/ros2_data_collection/dc_destinations/flb_plugins/lib/out_minio.so"
      endpoint: 127.0.0.1:9000
      access_key_id: HgJdDWeDQBiBWCwm
      secret_access_key: plCMROO2VMZIKiqEwDd80dLJUCRvJ9iu
      use_ssl: false
      bucket: "mybucket"
      src_fields: ["camera.local_img_paths.raw","camera.local_img_paths.rotated", "map.local_map_paths.yaml", "map.local_map_paths.pgm"]
      upload_fields: ["camera.minio_img_paths.raw","camera.minio_img_paths.rotated", "map.minio_map_paths.yaml", "map.minio_map_paths.pgm"]
    flb_pgsql:
      plugin: "dc_destinations/FlbPgSQL"
      inputs: ["/dc/group/memory_uptime"]
      host: "127.0.0.1"
      port: "5432"
      user: fluentbit
      password: password
      database: "fluentbit"
      table: "dc"
      timestamp_key: "date"
      async: false
      time_format: "double"
      time_key: "date"
    rcl:
      plugin: "dc_destinations/Rcl"
      inputs: ["/dc/group/memory_uptime"]
    flb_stdout:
      plugin: "dc_destinations/FlbStdout"
      inputs: ["/dc/group/cameras"]
      inputs: ["/dc/group/cameras"]
      time_format: "iso8601"
      time_key: "date"
    flb_http:
      plugin: "dc_destinations/FlbHTTP"
      inputs: ["/dc/group/memory_uptime"]
      debug: true
    flb_file:
      plugin: "dc_destinations/FlbFile"
      inputs: ["/dc/group/memory_uptime"]
      path: "$HOME/data"
      file: uptime
      debug: false
      throttle:
        enable: false
        rate: "1"
        window: "5"
        interval: "10s"
        print_status: true
AWS Kinesis Data Streams - Fluent Bit
Description
The Amazon Kinesis Data Streams output plugin allows to ingest your records into the Kinesis service. See fluent bit page for more information.
Parameters
| Parameter | Description | Type | Default |
|---|---|---|---|
| region | The AWS region. | str | N/A |
| stream | The name of the Kinesis Streams Delivery stream that you want log records sent to. | str | N/A |
| role_arn | ARN of an IAM role to assume (for cross account access). | str | N/A |
| time_key | Add the timestamp to the record under this key. By default the timestamp from Fluent Bit will not be added to records sent to Kinesis. | str | N/A |
| time_key_format | strftime compliant format string for the timestamp; for example, the default is '%Y-%m-%dT%H:%M:%S'. Supports millisecond precision with '%3N' and supports nanosecond precision with '%9N' and '%L'; for example, adding '%3N' to support millisecond '%Y-%m-%dT%H:%M:%S.%3N'. This option is used with time_key. | str | "%Y-%m-%dT%H:%M:%S" |
| log_key | By default, the whole log record will be sent to Kinesis. If you specify a key name with this option, then only the value of that key will be sent to Kinesis. For example, if you are using the Fluentd Docker log driver, you can specify log_key log and only the log message will be sent to Kinesis. | str | N/A |
| endpoint | Specify a custom endpoint for the Kinesis API. | str | N/A |
| auto_retry_requests | Immediately retry failed requests to AWS services once. This option does not affect the normal Fluent Bit retry mechanism with backoff. Instead, it enables an immediate retry with no delay for networking errors, which may help improve throughput when there are transient/random networking issues. This option defaults to true. | bool | true |
Node configuration
...
flb_kinesis_streams:
  plugin: "dc_destinations/FlbKinesisStreams"
  inputs: ["/dc/measurement/data"]
  region: "us-east-1"
  stream: my_stream
  time_key: "date"
  time_key_format: "%Y-%m-%dT%H:%M:%S"
...
AWS S3 - Fluent Bit
Description
The Amazon S3 output plugin allows to ingest your records into the S3 service. See fluent bit page for more information.
Parameters
| Parameter | Description | Type | Default |
|---|---|---|---|
| region | The AWS region of your S3 bucket. | str | "us-east-1" |
| bucket | S3 Bucket name. | str | N/A (Mandatory) |
| json_date_key | Specify the name of the time key in the output record. To disable the time key just set the value to false. | str | "date" |
| json_date_format | Specify the format of the date. Supported formats are double, epoch, iso8601 (eg: 2018-05-30T09:39:52.000681Z) and java_sql_timestamp (eg: 2018-05-30 09:39:52.000681). | str | "iso8601" |
| total_file_size | Specifies the size of files in S3. Maximum size is 50G, minimim is 1M. | str | "100M" |
| upload_chunk_size | The size of each 'part' for multipart uploads. Max: 50M. | str | "50M" |
| upload_timeout | Whenever this amount of time has elapsed, Fluent Bit will complete an upload and create a new file in S3. For example, set this value to 60m and you will get a new file every hour. | str | "10m" |
| store_dir | Directory to locally buffer data before sending. When multipart uploads are used, data will only be buffered until the upload_chunk_size is reached. S3 will also store metadata about in progress multipart uploads in this directory; this allows pending uploads to be completed even if Fluent Bit stops and restarts. It will also store the current $INDEX value if enabled in the S3 key format so that the $INDEX can keep incrementing from its previous value after Fluent Bit restarts. | str | "/tmp/fluent-bit/s3" |
| store_dir_limit_size | The size of the limitation for disk usage in S3. Limit the amount of s3 buffers in the store_dir to limit disk usage. Note: Use store_dir_limit_size instead of storage.total_limit_size which can be used to other plugins, because S3 has its own buffering system. | int | 0 |
| s3_key_format | Format string for keys in S3. This option supports a UUID, strftime time formatters, a syntax for selecting parts of the Fluent log tag using a syntax inspired by the rewrite_tag filter. Add $UUID in the format string to insert a random string. Add $INDEX in the format string to insert an integer that increments each upload. The $INDEX value will be saved in the store_dir so that if Fluent Bit restarts the value will keep incrementing from the previous run. Add $TAG in the format string to insert the full log tag; add $TAG[0] to insert the first part of the tag in the s3 key. The tag is split into “parts” using the characters specified with the s3_key_format_tag_delimiters option. Add extension directly after the last piece of the format string to insert a key suffix. If you want to specify a key suffix and you are in use_put_object mode, you must specify $UUID as well. More explanations can be found in the S3 Key Format explainer section further down in this document. See the in depth examples and tutorial in the documentation. Time in s3_key is the timestamp of the first record in the S3 file. | str | "/fluent-bit-logs/$TAG/%Y/%m/%d/%H/%M/%S" |
| static_file_path | Disables behavior where UUID string is automatically appended to end of S3 key name when $UUID is not provided in s3_key_format. $UUID, time formatters, $TAG, and other dynamic key formatters all work as expected while this feature is set to true. | bool | false |
| s3_key_format_tag_delimiters | A series of characters which will be used to split the tag into 'parts' for use with the s3_key_format option. See the in depth examples and tutorial in the documentation. | str | N/A |
| use_put_object | Use the S3 PutObject API, instead of the multipart upload API. When this option is on, key extension is only available when $UUID is specified in s3_key_format. If $UUID is not included, a random string will be appended at the end of the format string and the key extension cannot be customized in this case. | bool | false |
| role_arn | ARN of an IAM role to assume (ex. for cross account access). | str | N/A |
| endpoint | Custom endpoint for the S3 API. An endpoint can contain scheme and port. | str | N/A |
| sts_endpoint | Custom endpoint for the STS API. | str | N/A |
| canned_acl | Predefined Canned ACL policy. | str | N/A |
| compression | Compression type for S3 objects. 'gzip' is currently the only supported value by default. If Apache Arrow support was enabled at compile time, you can also use 'arrow'. For gzip compression, the Content-Encoding HTTP Header will be set to 'gzip'. Gzip compression can be enabled when use_put_object is 'on' or 'off' (PutObject and Multipart). Arrow compression can only be enabled with use_put_object On. | str | N/A |
| content_type | A standard MIME type for the S3 object; this will be set as the Content-Type HTTP header. | str | N/A |
| send_content_md5 | Send the Content-MD5 header with PutObject and UploadPart requests, as is required when Object Lock is enabled. | bool | false |
| auto_retry_requests | Immediately retry failed requests to AWS services once. This option does not affect the normal Fluent Bit retry mechanism with backoff. Instead, it enables an immediate retry with no delay for networking errors, which may help improve throughput when there are transient/random networking issues. | bool | true |
| log_key | By default, the whole log record will be sent to S3. If you specify a key name with this option, then only the value of that key will be sent to S3. For example, if you are using Docker, you can specify log_key log and only the log message will be sent to S3. | str | N/A |
| preserve_data_ordering | Normally, when an upload request fails, there is a high chance for the last received chunk to be swapped with a later chunk, resulting in data shuffling. This feature prevents this shuffling by using a queue logic for uploads. | bool | true |
| storage_class | Specify the storage class for S3 objects. If this option is not specified, objects will be stored with the default 'STANDARD' storage class. | str | N/A |
| retry_limit | Integer value to set the maximum number of retries allowed. For previous version, the number of retries is 5 and is not configurable. | int | 1 |
| external_id | Specify an external ID for the STS API, can be used with the role_arn parameter if your role requires an external ID. | str | N/A |
Node configuration
...
flb_s3:
  plugin: "dc_destinations/FlbS3"
  inputs: ["/dc/group/data"]
  bucket: my-bucket
  region: us-west-2
  total_file_size: "50M"
  use_put_object: false
  compression: "gzip"
  s3_key_format: "/$TAG/%Y/%m/%d/%H_%M_%S.gz"
...
File - Fluent Bit
Description
The file output plugin allows to write the data received through the input plugin to file. See fluent bit page for more information.
Parameters
| Parameter | Description | Type | Default |
|---|---|---|---|
| file | Set file name to store the records. If not set, the file name will be the tag associated with the records. | str | N/A (Optional) |
| format | The format of the file content. See also Format section. | str(out_file,plain,csv,ltsv) | "out_file" |
| mkdir | Recursively create output directory if it does not exist. Permissions set to 0755. | bool | true |
| path | Directory path to store files. If not set, Fluent Bit will write the files on it's own positioned directory. | str | "$HOME/data/" |
| delimiter | The character to separate each data. Default to ',' if format=csv, '\t'(TAB) if format=ltsv, '' else. | str | '' or ',' or '\t' |
| label_delimiter | The character to separate label and the value. Default: ':'. Used for ltsv. | str | '.' |
Node configuration
...
flb_file:
  plugin: "dc_destinations/FlbFile"
  inputs: ["/dc/group/cameras"]
  file: "data"
  format: "out_file"
  mkdir: true
  path: "$HOME/data/"
...
Files metrics - Fluent Bit
Description
Tracks files (yaml files, jpg pictures etc.) sent to their destinations (s3, minio etc.). We can then delete files locally when they have been sent to all their storage destinations.
It loads a Fluent Bit plugin we wrote ourselves to do this task, located in the fluent_bit_plugins package.
It creates a table on the database (currently PostgreSQL only) to store each file status.
erDiagram
    files_metrics {
        integer id
        timestamp timestamp
        text robot_name
        text robot_id
        text group_name
        double duration
        text local_path
        text remote_path
        bool uploaded
        bool on_filesystem
        bool deleted
        bool ignored
        text storage_type
        text content_type
        integer size
        timestamp created_at
        timestamp updated_at
    }
Parameters
| Parameter | Description | Type | Default |
|---|---|---|---|
| db_type | Database used. | str | "pgsql" |
| file_storage | Where data will be stored. | list[str](s3, minio) | N/A (Mandatory) |
| delete_when_sent | Delete file when sent. | bool | true |
| minio.access_key_id | Minio Access key ID. | str | N/A (Mandatory) |
| minio.bucket | Minio bucket name. | str | "dc_bucket" |
| minio.endpoint | Minio endpoint. | str | "127.0.0.1:9000" |
| minio.secret_access_key | Minio Secret access key. | str | N/A (Mandatory) |
| minio.src_fields | JSON fields containing local paths for Minio. | str | N/A (Mandatory) |
| minio.upload_fields | JSON fields containing remote paths for Minio. | str | N/A (Mandatory) |
| minio.use_ssl | Use SSL for Minio. | bool | true |
| plugin_path | Shared library path compiled by go. | str | "{package_share_directory}/flb_plugins/lib/out_files_metrics.so" |
| pgsql.database | Database name to connect to. | str | <system_username> |
| pgsql.host | Hostname/IP address of the PostgreSQL instance. | str | "127.0.0.1" |
| pgsql.password | Password of PostgreSQL username. | str | "" |
| pgsql.port | PostgreSQL port. | str | "5432" |
| pgsql.ssl | Use ssl for PostgreSQL connection. | bool | true |
| pgsql.table | Table name where to store data. | str | "pg_table" |
| pgsql.user | PostgreSQL username. | str | <system_username> |
| plugin_path | Shared library of the plugin. | str | <install_path>/lib/out_files_metrics.so |
| s3.access_key_id | S3 Access key ID. | str | N/A (Mandatory) |
| s3.bucket | S3 bucket name. | str | N/A (Mandatory) |
| s3.endpoint | S3 endpoint. | str | N/A (Mandatory) |
| s3.secret_access_key | S3 Secret access key. | str | N/A (Mandatory) |
| s3.src_fields | JSON fields containing local paths for s3. | str | N/A (Mandatory) |
| s3.upload_fields | JSON fields containing remote paths for S3. | str | N/A (Mandatory) |
Example
flb_files_metrics:
    plugin: "dc_destinations/FlbFilesMetrics"
    inputs: ["/dc/group/map"]
    file_storage: ["minio", "s3"]
    db_type: "pgsql"
    debug: true
    delete_when_sent: true
    minio:
        endpoint: 127.0.0.1:9000
        access_key_id: XEYqG4ZcPY5jiq5i
        secret_access_key: ji011KCtI82ZeQS6UwsQAg8x9VR4lSaQ
        use_ssl: false
        bucket: "mybucket"
        src_fields: ["map.local_paths.pgm", "map.local_paths.yaml"]
        upload_fields: ["map.minio_paths.pgm", "map.minio_paths.yaml"]
    s3:
        endpoint: 127.0.0.1:9000
        access_key_id: XEYqG4ZcPY5jiq5i
        secret_access_key: ji011KCtI82ZeQS6UwsQAg8x9VR4lSaQ
        bucket: "mybucket"
        src_fields: ["map.local_paths.yaml"]
        upload_fields: ["map.s3_paths.yaml"]
    pgsql:
        host: "127.0.0.1"
        port: "5432"
        user: fluentbit
        password: password
        database: "fluentbit"
        table: "files_metrics"
        timestamp_key: "date"
        time_format: "double"
        time_key: "date"
        ssl: false
HTTP - Fluent Bit
Description
The http output plugin allows to flush your records into a HTTP endpoint. For now the functionality is pretty basic and it issues a POST request with the data records in MessagePack (or JSON) format. See fluent bit page for more information.
Parameters
| Parameter | Description | Type | Default |
|---|---|---|---|
| allow_duplicated_headers | Specify if duplicated headers are allowed. If a duplicated header is found, the latest key/value set is preserved. | bool | true |
| format | Specify the data format to be used in the HTTP request body, by default it uses msgpack. Other supported formats are json, json_stream and json_lines and gelf. | str | "json" |
| header | Add a HTTP header key/value pair. Multiple headers can be set. | str | N/A |
| headers_key | Specify the key to use as the headers of the request (must prefix with "$"). The key must contain a map, which will have the contents merged on the request headers. This can be used for many purposes, such as specifying the content-type of the data contained in body_key. | str | N/A |
| header_tag | Specify an optional HTTP header field for the original message tag. | str | N/A |
| http_user | Basic Auth Username. | str | N/A |
| http_passwd | Basic Auth Password. Requires HTTP_User to be set. | str | N/A |
| json_date_format | Specify the format of the date. Supported formats are double, epoch, iso8601 (eg: 2018-05-30T09:39:52.000681Z) and java_sql_timestamp (eg: 2018-05-30 09:39:52.000681). | str | "double" |
| json_date_key | Specify the name of the time key in the output record. To disable the time key just set the value to false. | str | "date" |
| host | IP address or hostname of the target HTTP Server. | str | "127.0.0.1" |
| log_response_payload | Specify if the response paylod should be logged or not. | str | true |
| port | TCP port of the target HTTP Server | str | "80" |
| uri | Specify an optional HTTP URI for the target web server, e.g: /something. | str | "/" |
Node configuration
...
flb_http:
  plugin: "dc_destinations/FlbHTTP"
  inputs: ["/dc/measurement/data"]
  host: "127.0.0.1"
  port: 80
  uri: "/"
  format: "json"
...
InfluxDB - Fluent Bit
Description
The influxdb output plugin, allows to flush your records into a InfluxDB time series database. The following instructions assumes that you have a fully operational InfluxDB service running in your system. See fluent bit page for more information.
Parameters
| Parameter | Description | Type | Default |
|---|---|---|---|
| host | IP address or hostname of the target InfluxDB service. | str | "127.0.01" |
| port | TCP port of the target InfluxDB service. | int | 8086 |
| database | InfluxDB database name where records will be inserted. | str | "fluentbit" |
| bucket | InfluxDB bucket name where records will be inserted - if specified, database is ignored and v2 of API is used. | str | N/A (Optional) |
| org | InfluxDB organization name where the bucket is (v2 only). | str | "fluent" |
| sequence_tag | The name of the tag whose value is incremented for the consecutive simultaneous events. | str | "_seq" |
| http_user | Optional username for HTTP Basic Authentication. | str | N/A (Optional) |
| http_passwd | Password for user defined in HTTP_User. | str | N/A (Optional) |
| http_token | Authentication token used with InfluDB v2 - if specified, both HTTP_User and HTTP_Passwd are ignored. | str | N/A (Optional) |
| tag_keys | List of keys that needs to be tagged. | list[str] | N/A (Optional) |
| auto_tags | Automatically tag keys where value is string. | bool | false |
Node configuration
...
flb_influxdb:
  plugin: "dc_destinations/FlbInfluxDB"
  inputs: ["/dc/measurement/uptime"]
  host: "127.0.0.1"
  port: 8086
  database: "ros"
...
Minio - Fluent Bit
Description
The Minio Plugin allows to send files to Minio. It uses the GO interface provided by Fluent Bit.
Difference with Fluent Bit S3 Plugin
The S3 plugin sends data as JSON to S3 or Minio but does not send files (e.g yaml, images etc.).
Parameters
| Parameter | Description | Type | Default |
|---|---|---|---|
| plugin_path | Shared library path compiled by go. | str | "{package_share_directory}/flb_plugins/lib/out_minio.so" |
| endpoint | Endpoint for the S3 API. An endpoint can contain scheme and port. | str | "127.0.0.1:9000" |
| access_key_id | Access keys are long-term credentials for an IAM user or the AWS account root user. | str | N/A (mandatory) |
| secret_access_key | Secret-like password to connect along he access key id. | str | N/A (mandatory) |
| use_ssl | If set to true, https is used instead of http. Default is true. | str | "true" |
| create_bucket | Whether the bucket will be created. | str | "true" |
| bucket | Bucket name. | str | "dc_bucket" |
| upload_fields | Fields containing remote paths, separated by dots. | list[str] | N/A (mandatory) |
| src_fields | Fields containing local paths, separated by dots. | list[str] | N/A (mandatory) |
Node configuration
...
flb_minio:
  verbose_plugin: false
  time_format: "iso8601"
  plugin: "dc_destinations/FlbMinIO"
  inputs: ["/dc/measurement/camera", "/dc/measurement/map"]
  endpoint: 127.0.0.1:9000
  access_key_id: XEYqG4ZcPY5jiq5i
  secret_access_key: ji011KCtI82ZeQS6UwsQAg8x9VR4lSaQ
  use_ssl: false
  create_bucket: true
  bucket: "mybucket"
  src_fields:
    [
      "local_paths.inspected"
      "local_paths.minio.pgm"
      "local_paths.minio.yaml"
    ]
  upload_fields: # Remote paths created by the measurement node configuration
    [
      "remote_paths.minio.inspected",
      "remote_paths.minio.pgm"
      "remote_paths.minio.yaml"
    ]
...
Parameter handling
flowchart TB

  subgraph ros2_plugin["Measurement plugin"]
    direction LR
    mp_src_fields["['local_paths.inspected', 'local_paths.minio.pgm', 'local_paths.minio.yaml']"]
    mp_upload_fields["['remote_paths.inspected', 'remote_paths.minio.pgm', 'remote_paths.minio.yaml']"]
  end

  subgraph flb_plugin["Fluent Bit plugin"]
    direction LR
    flb_src_fields["'local_paths.inspected, local_paths.minio.pgm, local_paths.minio.yaml'"]
    flb_upload_fields["'remote_paths.inspected, remote_paths.minio.pgm, remote_paths.minio.yaml'"]

    flb_split_src_fields["['local_paths.inspected', 'local_paths.minio.pgm', 'local_paths.minio.yaml']"]
    flb_split_upload_fields["['remote_paths.inspected', 'remote_paths.minio.pgm', 'remote_paths.minio.yaml']"]
  end

  mp_src_fields--"to string"-->flb_src_fields
  mp_upload_fields--"to string"-->flb_upload_fields
  flb_src_fields--"to go array"-->flb_split_src_fields
  flb_upload_fields--"to go array"-->flb_split_upload_fields
NULL - Fluent Bit
Description
The null output plugin just throws away events. See fluent bit page for more information.
Node configuration
...
flb_null:
  plugin: "dc_destinations/FlbNull"
  inputs: ["/dc/measurement/data"]
...
PostgreSQL - Fluent Bit
Description
PostgreSQL is a very popular and versatile open source database management system that supports the SQL language and that is capable of storing both structured and unstructured data, such as JSON objects. See fluent bit page for more information.
Parameters
| Parameter | Description | Type | Default |
|---|---|---|---|
| host | Hostname/IP address of the PostgreSQL instance. | str | "127.0.0.1" |
| port | PostgreSQL port. | str | "5432" |
| user | PostgreSQL username. | str | "{username}" |
| password | Password of PostgreSQL username. | str | N/A |
| database | Database name to connect to. | str | "{username}" |
| table | Table name where to store data. | str | N/A |
| timestamp_Key | Key in the JSON object containing the record timestamp. | str | "date" |
| async | Define if we will use async or sync connections. | bool | false |
| min_pool_size | Minimum number of connection in async mode. | str | "1" |
| max_pool_size | Maximum amount of connections in async mode. | str | "4" |
| cockroachdb | Set to true if you will connect the plugin with a CockroachDB. | bool | false |
Node configuration
...
flb_pgsql:
  plugin: "dc_destinations/FlbPgSQL"
  inputs: ["/dc/group/data"]
  host: "127.0.0.1"
  port: 5432
  user: fluentbit
  password: password
  database: "fluentbit"
  table: "dc"
  timestamp_key: "date"
  async: false
  time_format: "double"
  time_key: "date"
...
Slack - Fluent Bit
Description
The Slack output plugin delivers records or messages to your preferred Slack channel. See fluent bit page for more information.
Parameters
| Parameter | Description | Type | Default |
|---|---|---|---|
| webhook | Absolute address of the Webhook provided by Slack. | str | N/A (Mandatory) |
Node configuration
...
flb_slack:
  plugin: "dc_destinations/FlbSlack"
  inputs: ["/dc/group/data"]
  webhook: https://hooks.slack.com/services/T00000000/B00000000/XXXXXXXXXXXXXXXXXXXXXXXX
...
File - Fluent Bit
Description
The stdout output plugin allows to print to the standard output the data received through the input plugin. See fluent bit page for more information.
Parameters
| Parameter | Description | Type | Default |
|---|---|---|---|
| format | Specify the data format to be printed. Supported formats are msgpack json, json_lines and json_stream. | str | "json" |
| json_date_key | Specify the name of the time key in the output record. To disable the time key just set the value to false. | str | "date" |
| json_date_format | Specify the format of the date. Supported formats are double, epoch, iso8601 (eg: 2018-05-30T09:39:52.000681Z) and java_sql_timestamp (eg: 2018-05-30 09:39:52.000681). | str | "double" |
Node configuration
...
flb_stdout:
  plugin: "dc_destinations/FlbStdout"
  inputs: ["/dc/group/data"]
  format: "json"
  json_date_key: "date"
  json_date_format: "iso8601"
...
TCP & TLS - Fluent Bit
Description
The tcp output plugin allows to send records to a remote TCP server. The payload can be formatted in different ways as required.. See fluent bit page for more information.
Parameters
| Parameter | Description | Type | Default |
|---|---|---|---|
| host | Target host where Fluent-Bit or Fluentd are listening for Forward messages. | str | "127.0.0.1" |
| port | TCP Port of the target service. | int(>0 <65536) | 5170 |
| format | Specify the data format to be printed. Supported formats are msgpack json, json_lines and json_stream. | str | "msgpack" |
| json_date_key | Specify the name of the time key in the output record. To disable the time key just set the value to false. | str | "date" |
| json_date_format | Specify the format of the date. Supported formats are double, epoch, iso8601 (eg: 2018-05-30T09:39:52.000681Z) and java_sql_timestamp (eg: 2018-05-30 09:39:52.000681) | str | "double" |
| workers | Enables dedicated thread(s) for this output. Default value is set since version 1.8.13. For previous versions is 0. | int | 2 |
| tls.active | Enable or disable TLS support. | bool | false |
| tls.verify | Force certificate validation. | bool | true |
| tls.debug | Set TLS debug verbosity level. It accept the following values: 0 (No debug), 1 (Error), 2 (State change), 3 (Informational) and 4 Verbose. | int(>=0 <=4) | 1 |
| tls.ca_file | Absolute path to CA certificate file. | str | N/A (Optional) |
| tls.crt_file | Absolute path to Certificate file. | str | N/A (Optional) |
| tls.key_file | Absolute path to private Key file. | str | N/A (Optional) |
| tls.key_passwd | Optional password for tls.key_file file. | str | N/A (Optional) |
Node configuration
...
flb_tcp:
  plugin: "dc_destinations/FlbTCP"
  inputs: ["/dc/measurement/uptime"]
  host: "127.0.0.1"
  port: 5170
...
RCL - RCLCPP
Description
The RCL output collects the data with ROS and display it with RCLCPP_INFO call.
Warning
Note that plugins which are not using Fluent Bit like this one don't have any data integrity and persistence. Do not use in production!
Configuration examples
Through minimal code examples, you will learn how to collect and send data with DC.
It will progressively present all features.
By here, you must have built the workspace following the setup guide.
Copy the configuration and save it as a yaml file, and then run:
ros2 launch dc_bringup params_file:="my_file.yaml"
Running the examples
Example 1: Uptime to Fluent Bit Stdout every second and flush data every second
destination_server:                           # Destination node configuration
  ros__parameters:
    destination_plugins: ["flb_stdout"]       # List of destination plugins names to enable
    flb_stdout:                               # Plugin name, you choose
      plugin: "dc_destinations/FlbStdout"     # Plugin class name, fixed
      inputs: ["/dc/measurement/uptime"]      # Same as topic_output in the uptime measurement in measurement_server

measurement_server:                           # Measurement node configuration
  ros__parameters:
    measurement_plugins: ["uptime"]           # List of measurement plugins names to enable
    uptime:                                   # Plugin name, you choose
      plugin: "dc_measurements/Uptime"        # Plugin class name, fixed
      topic_output: "/dc/measurement/uptime"  # Topic where data will be published
      tags: ["flb_stdout"]                    # Fluent Bit will match this in the destination server
Example 2: Uptime to Fluent Bit Stdout every second and flush data every 3 seconds
destination_server:
  ros__parameters:
    flb:
      flush: 3                               # Interval to flush output (seconds)
    destination_plugins: ["flb_stdout"]
    flb_stdout:
      plugin: "dc_destinations/FlbStdout"
      inputs: ["/dc/measurement/uptime"]

measurement_server:
  ros__parameters:
    measurement_plugins: ["uptime"]
    uptime:
      plugin: "dc_measurements/Uptime"
      topic_output: "/dc/measurement/uptime"
      tags: ["flb_stdout"]
Example 3: Uptime to Fluent Bit Stdout only at start and 3 times
destination_server:
  ros__parameters:
    destination_plugins: ["flb_stdout"]
    flb_stdout:
      plugin: "dc_destinations/FlbStdout"
      inputs: ["/dc/measurement/uptime"]

measurement_server:
  ros__parameters:
    measurement_plugins: ["uptime"]
    uptime:
      plugin: "dc_measurements/Uptime"
      topic_output: "/dc/measurement/uptime"
      tags: ["flb_stdout"]
      init_max_measurements: 3               # Maximum records to collect
Example 4: CPU and Memory to Fluent Bit Stdout every 5 seconds forever
destination_server:
  ros__parameters:
    destination_plugins: ["flb_stdout"]
    flb_stdout:
      plugin: "dc_destinations/FlbStdout"
      inputs: ["/dc/measurement/cpu", "/dc/measurement/memory"]

measurement_server:
  ros__parameters:
    measurement_plugins: ["memory", "cpu"]
    memory:
      plugin: "dc_measurements/Memory"
      topic_output: "/dc/measurement/memory"
      polling_interval: 5000                  # Interval to which data is collected in milliseconds
      tags: ["flb_stdout"]
    cpu:
      plugin: "dc_measurements/Cpu"
      topic_output: "/dc/measurement/cpu"
      polling_interval: 5000                  # Interval to which data is collected in milliseconds
      tags: ["flb_stdout"]
Example 5: CPU and Memory as a group to Fluent Bit Stdout every 5 seconds forever
destination_server:
  ros__parameters:
    destination_plugins: ["flb_stdout"]
    flb_stdout:
      plugin: "dc_destinations/FlbStdout"
      inputs: ["/dc/group/memory_cpu"]        # Group to create

group_server:                                 # Group server configuration
  ros__parameters:
    groups: ["cpu_memory"]
    cpu_memory:
      inputs: ["/dc/measurement/cpu", "/dc/measurement/memory"] # Topics which are subscribed
      output: "/dc/group/cpu_memory"          # Topic where result will be published
      sync_delay: 5.0                         # How long to queue up messages before passing them through.
      group_key: "cpu_memory"
      tags: ["flb_stdout"]

measurement_server:
  ros__parameters:
    measurement_plugins: ["memory", "cpu"]
    memory:
      plugin: "dc_measurements/Memory"
      topic_output: "/dc/measurement/memory"
      polling_interval: 5000
      tags: ["flb_stdout"]
    cpu:
      plugin: "dc_measurements/Cpu"
      topic_output: "/dc/measurement/cpu"
      polling_interval: 5000
      tags: ["flb_stdout"]
Example 6: Custom ROS message to Stdout every 2 seconds forever
destination_server:
  ros__parameters:
    destination_plugins: ["flb_stdout"]
    flb_stdout:
      plugin: "dc_destinations/FlbStdout"
      inputs: ["/dc/measurement/string_stamped"]

measurement_server:
  ros__parameters:
    measurement_plugins: ["my_string_stamped"]
    my_string_stamped:
      plugin: "dc_measurements/StringStamped"           # Plugin that allow to publish from your nodes
      topic_output: "/dc/measurement/my_string_stamped" # Topic where data is republished with tags
      topic: "/hello-world"                             # Input topic where you are publishing
      tags: ["flb_stdout"]
      polling_interval: 2000
      enable_validator: false                           # By default, StringStamped message does not have a JSON schema since it uses custom input data
You will then need in another terminal to publish data on the input topic (/hello-world)
ros2 topic pub -r 1 /hello-world dc_interfaces/msg/StringStamped "{data: '{\"hello\":\"world\"}'}"
Example 7: Custom ROS message to Stdout every time it is published
destination_server:
  ros__parameters:
    destination_plugins: ["flb_stdout"]
    flb_stdout:
      plugin: "dc_destinations/FlbStdout"
      inputs: ["/dc/measurement/string_stamped"]

measurement_server:
  ros__parameters:
    measurement_plugins: ["my_string_stamped"]
    my_string_stamped:
      plugin: "dc_measurements/StringStamped"
      topic_output: "/dc/measurement/my_string_stamped"
      topic: "/hello-world"
      tags: ["flb_stdout"]
      enable_validator: false
      timer_based: false                                 # Get all data published on the input topic. Ignores polling_interval
Now that you know how it works, you can set your own measurements and destinations.
Infrastructure setup
InfluxDB
Description
PostgreSQL is a powerful, open source object-relational database system that uses and extends the SQL language combined with many features that safely store and scale the most complicated data workloads. The origins of PostgreSQL date back to 1986 as part of the POSTGRES project at the University of California at Berkeley and has more than 35 years of active development on the core platform.
Start with docker compose
Execute:
./tools/infrastructure/scripts/install_infrastructure.bash \
  --tool=influxdb
  --install-type=docker
Start natively
./tools/infrastructure/scripts/install_infrastructure.bash \
  --tool=influxdb
  --install-type=native
Credentials
| User | Password | Database | Port |
|---|---|---|---|
| admin | admin | dc | 8086 |
Ip cameras
To start the ip camera example, to save video feeds from rtsp cameras, you can optionally create a virtual video feed if you don't have an ip camera, for testing purpose:
Start RTSP Server
A rtsp server. I use mediamtx available here. Download from the release page and start it:
./mediamtx
If the port is already used, download the configuration and edit the hlsAddress parameter. You would then need to start it this way:
./mediamtx conf.yml
Create a virtual camera
This is optional, and only useful if you want to not use a camera
You will first need to install some packages:
sudo apt-get install v4l-utils v4l2loopback
And start a virtual camera device:
sudo modprobe v4l2loopback
Now check its path:
v4l2-ctl --list-devices

Dummy video device (0x0000) (platform:v4l2loopback-000):
	/dev/video2
In my case, it is /dev/video2
To send your camera feed, run:
ffmpeg \
  -f v4l2 \
  -video_size 1920x1080 \
  -i /dev/video2 \
  -f rtsp \
  -rtsp_transport tcp rtsp://127.0.0.1:8554/mystream
Send video stream
To send an image of a clock ticking, create a blank image and call it bg-white.png (with gimp for example) and run:
ffmpeg \
  -re -loop 1 \
  -i bg-white.png \
  -vf drawtext="fontfile=monofonto.ttf: fontsize=96: box=1: boxcolor=black@0.75: boxborderw=5: fontcolor=white: x=(w-text_w)/2: y=((h-text_h)/2)+((h-text_h)/4): text='%{gmtime\:%H\\\\\:%M\\\\\:%S}'" \
  -r 25 \
  -vcodec libx264 \
  -f rtsp -rtsp_transport tcp rtsp://127.0.0.1:8554/mystream
Now you can use the ip_camera plugin with the url from the command: rtsp://127.0.0.1:8554/mystream
MinIO
Requirements
- Docker installed
- Docker compose installed
Description
MinIO is an object storage solution that provides an Amazon Web Services S3-compatible API and supports all core S3 features. MinIO is built to deploy anywhere - public or private cloud, baremetal infrastructure, orchestrated environments, and edge infrastructure.
Start with Docker compose
Execute:
./tools/infrastructure/scripts/install_infrastructure.bash \
  --tool=minio \
  --install-type=docker
Start natively
./tools/infrastructure/scripts/install_infrastructure.bash \
  --tool=minio \
  --install-type=native
How to use
This will start MinIO API and dashboard (a GUI to see and interact with the data)
By accessing localhost:9001, you should be able to see this page:
Username: minioadmin Password: minioadmin
Create an access key
Go to the Access Keys page and click on "Create access key"
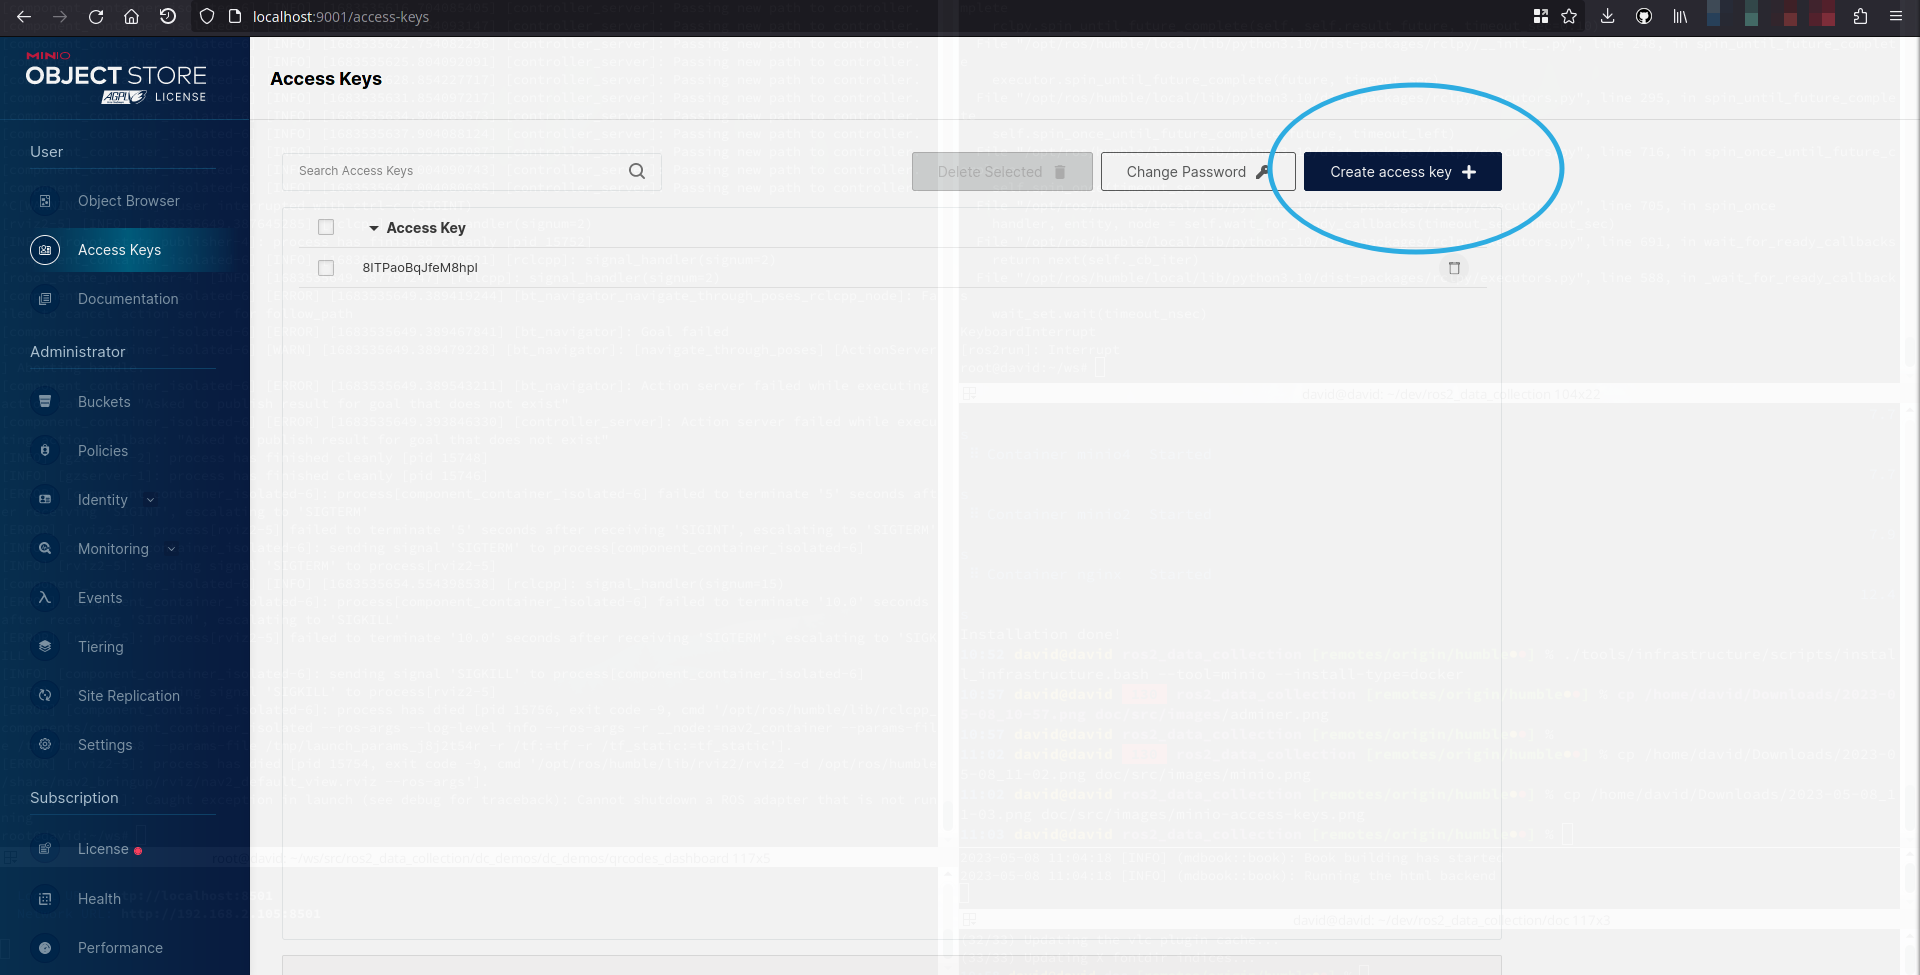
Take note of the access and secret key and add them in your required launch file configuration late on.
Credentials
| User | Password | Port |
|---|---|---|
| minioadmin | minioadmin | 9000, 9001 |
PostgreSQL
Description
PostgreSQL is a powerful, open source object-relational database system that uses and extends the SQL language combined with many features that safely store and scale the most complicated data workloads. The origins of PostgreSQL date back to 1986 as part of the POSTGRES project at the University of California at Berkeley and has more than 35 years of active development on the core platform.
Start with docker compose
Execute:
./tools/infrastructure/scripts/install_infrastructure.bash \
  --tool=postgresql \
  --install-type=docker
Start natively
Execute:
./tools/infrastructure/scripts/install_infrastructure.bash \
  --tool=postgresql \
  --install-type=native
Credentials
| User | Password | Database | Port |
|---|---|---|---|
| dc | password | dc | 5432 |
CLI tools
List plugins
You can list available plugins by running the CLI tool:
ros2 run dc_cli list_plugins --help


 Usage: list_plugins [OPTIONS] COMMAND [ARGS]...

╭─ Options ─────────────────────────────────────────────────────────────────────────────────────────────────────────────────╮
│ --install-completion          Install completion for the current shell.                                                   │
│ --show-completion             Show completion for the current shell, to copy it or customize the installation.            │
│ --help                        Show this message and exit.                                                                 │
╰───────────────────────────────────────────────────────────────────────────────────────────────────────────────────────────╯
╭─ Commands ────────────────────────────────────────────────────────────────────────────────────────────────────────────────╮
│ by-package       List plugins of a pluginlib file with their descriptions, by package name and filename.                  │
│ by-path          List plugins of a pluginlib file with their descriptions, by their path.                                 │
│ conditions       List condition plugins with their descriptions.                                                          │
│ destinations     List destination plugins with their descriptions.                                                        │
│ measurements     List measurement plugins with their descriptions.                                                        │
╰───────────────────────────────────────────────────────────────────────────────────────────────────────────────────────────╯
Requirements
Requirements are tracked using Strictdoc.
The goal is to list tasks and do test based requirements.
Future work and Roadmap
DC still being in early development, it requires:
- High test coverage
- Automation: docker image build, PR and commit builds
- More measurement plugins
- More destination plugins
- Guide for the Backend developer: I would like DC to be simple enough so a web developer can run it, get the data and work on its backend application
- Guide for the ROS developer: I would like DC to be simple enough so a ROS developer can collect data without the expertise of knowing how to manage databases
- Handle python destination plugins
- More use cases showcased in demos
Participating
TLDR
| Event | What to do |
|---|---|
| Want to contribute | Open a PR |
| Found a bug | File a ticket on Github Issues |
| Feature request | Describe what you want on Github Discussions |
| Want to start a discussion | Start one on Github Discussions |
| Be aware of the ongoing development | Take a look at the Github Project and what is being worked on |
Contributing
Feature requests
Since I want DC to be community driven, go to Github discussions, start a discussion about a features you want to see and users will be able to vote for your it. Most requested features will have more attention than others.
Found a bug?
If you find a problem, first search if an issue already exists. If a related issue doesn't exist, you can open a new issue using the issue form.
General guidelines
You can contribute to the source code with Pull Requests, for example:
- To fix a typo you found on the documentation.
- To propose new documentation sections.
- To fix an existing issue/bug.
- Make sure to add tests.
- To add a new feature.
- Make sure to add tests.
- Make sure to add documentation if it's relevant.
Setup environment
ROS
Follow the steps to build your workspace and install dependencies in the setup section
Then, install the pre-commit hook:
pre-commit install
You are now ready to write some code, commit and follow the standards with the pre-commit hook.
Docs
To build the docs, install cargo:
sudo apt-get install cargo
Then install mdbook (the command line tool to create books with Markdown) and its plugins:
cargo install mdbook mdbook-admonish mdbook-linkcheck mdbook-mermaid
Start the doc locally with auto-refresh on edit:
export PATH=$PATH:$HOME/.cargo/bin
mdbook serve -p 8000 -n 0.0.0.0
And open localhost:8000
Now that you open see the documentation locally, open the doc folder of the repository and edit the Markdown files you need. More about mdbook can be found here
Tests
TODO...
FAQ
I can't find a measurement and/or destination I need
Even though measurements and destinations will constantly be added in the future, the current focus is on getting feedback, fixing bugs, documentation and reach a minimum test coverage.
Create a feature request in Github Discussions...or better, write your plugin and do a Pull Request.
Can I use DC without Fluent Bit backend?
It is possible to use DC without Fluent Bit as backend. There is an example with the RCL destination, which subscribes to a ROS topic and prints it in the console.
Still, a lot of work would be required to disable Fluent Bit and keep similar features (backpressure handling, data persistence and measurements and destinations available)
How can I add a Fluent Bit plugin?
Currently, from my knowledge, it is only possible to load a plugin using the C api which loads a shared library. Because of that, I expect more languages can be used, such as Rust, the only requirement is to use the bindings. For measurements, it is not a problem, we can write a node in any language publishing on a StringStamped message and use the measurement plugin with the same name.
Destination plugins can be written in C or Go. You can find examples in the fluent_bit_plugins package.
How can I use a Python API with Fluent Bit
Adding a destination plugin which uses a Python library is not cleared. We have not yet solved this problem and would welcome one, since many API libraries are available in this language.
Note for the courageous ones: I tried once to create python-C bindings of Fluent Bit, by creating .h files like in the fluent-bit-go and use ctypesgen(https://github.com/ctypesgen/ctypesgen), like this:
ctypesgen \
  --allow-gnu-c \
  --output-language=py32 \
  ~/ws/fluent-bit/include/fluent-bit.h \
  -I./lib/msgpack-c/include/ \
  -I./lib/monkey/include \
  -I./build/lib/monkey/include/monkey \
  -I./lib/cfl/include \
  -I./lib/cfl/lib/xxhash \
  -I./include \
  -I./lib/flb_libco \
  -I./lib/c-ares-1.19.0/include \
  -I./lib/cmetrics/include \
  -I./lib/ctraces/include \
  -I./lib/ctraces/lib/mpack/src \
  -o fluent_bit.py
It creates a base for the bindings. While I suppose it is possible to generate them, I'm puzzled as how this will be loaded by Fluent Bit afterwards.
Whatever you write, feel free to make a Pull Request and share your work!
My group data is not published on the group topic
This may happen for different reasons:
- The group node is not started, be sure it is (ros2 node list), you will need to enable it in your launch file or using the
group_node:=truewhen launching the bringup - Data is not being published on all topics it subscribes to (use ros2 topic echo on each to ensure that). Currently, if all topics don't publish, there is no way to ignore that and still send the message partially full (see here). Help is welcome here :)
About and Contact
About
Our team currently includes:
| Name | GitHub ID | Current Role |
|---|---|---|
| David Bensoussan | Minipada |
Contact
For any inquiry, please contact David (d.bensoussan@proton.me). If your inquiry relates to bugs or open-source feature requests, consider posting a ticket on our GitHub project. If your inquiry relates to configuration support or private feature development, reach out and we will be able to support you in your projects.