Turtlebot3
In this example, we add a robot and start collecting robot data to Stdout.
You will also need 3 terminal windows, to:
- Run the Nav2 turtlebot3 launchfile: it starts localization, navigation and RViz
- Run navigation inspection demo
- Run DC
Using a different terminal window for DC helps reading its information.
Setup the environment
Python dependencies
For this tutorial, we will need to install all dependencies, the demo dashboard's included (uv owns them; see Setup):
uv sync
Setup Infrastructure
RustFS
RustFS will be used as storage for images and other files. To start it, follow the steps — a single RustFS container plus a one-shot container that bootstraps the dc-files bucket, using the default rustfsadmin/rustfsadmin credentials this demo's params file already assumes. No manual bucket or key setup is needed, unlike the old 4-node MinIO cluster + nginx console this replaces.
PostgreSQL
PostgreSQL will be used as database storage for our JSON. Later on, backend engineers can make requests on those JSON based on measurement requested and time range. To start it, follow the steps
The default yaml configuration file does not need change as it also uses default values.
tools/infrastructure/docker/config/postgresql/init.sql pre-creates the dc and dc_files tables Vector's postgres sink writes into — it maps each Record's top-level JSON keys onto existing columns of the same name rather than creating them itself. See the file's header comment for the full column reference.
Setup simulation environment
In the terminal 1, source your environment:
source /opt/ros/jazzy/setup.bash
source install/setup.bash
Nothing else has to be exported. dc_simulation puts its own models and worlds on
GZ_SIM_RESOURCE_PATH through its environment hook.
This demo used to run aws_robomaker_small_warehouse_world under Gazebo Classic. That
package has no Jazzy release — its own jazzy branch still hard-depends on gazebo_ros,
which was never published for Jazzy. The warehouse now comes from dc_simulation
instead, which vendors the same AWS RoboMaker props (shelves, clutter, trash cans) into
a gz-sim world of its own.
Terminal 1: Start Navigation
Then, in the same terminal (1), start the simulation and Nav2. DC comes up separately in terminal 2, so turn it off here:
ros2 launch dc_demos tb3_qrcodes.launch.py \
    headless:=False \
    use_dc:=False
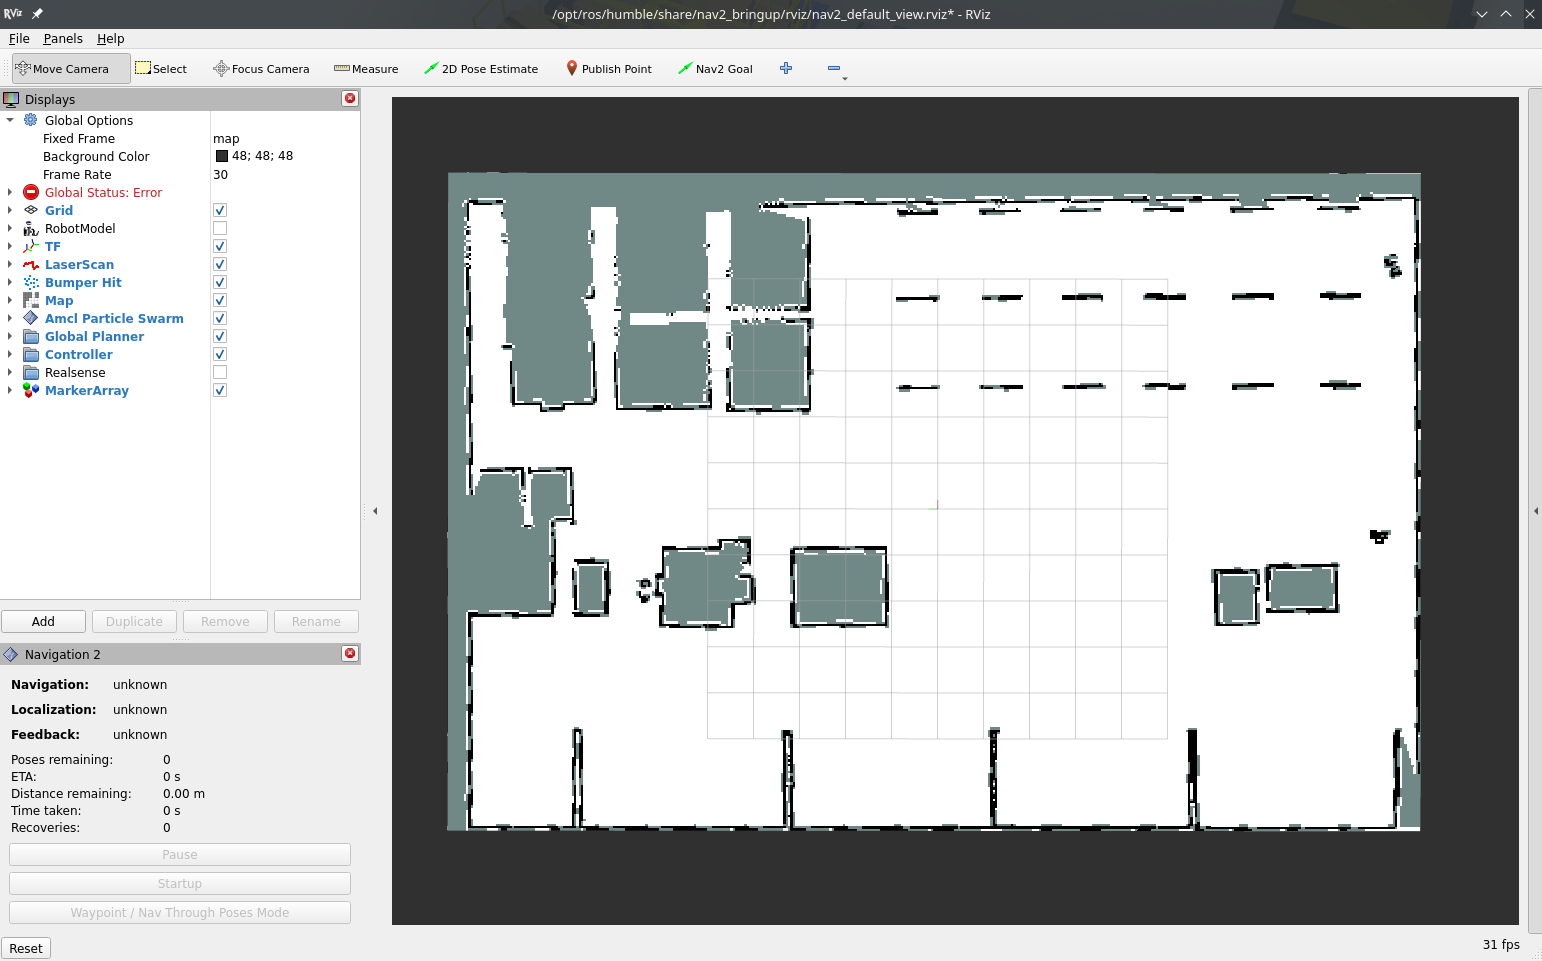
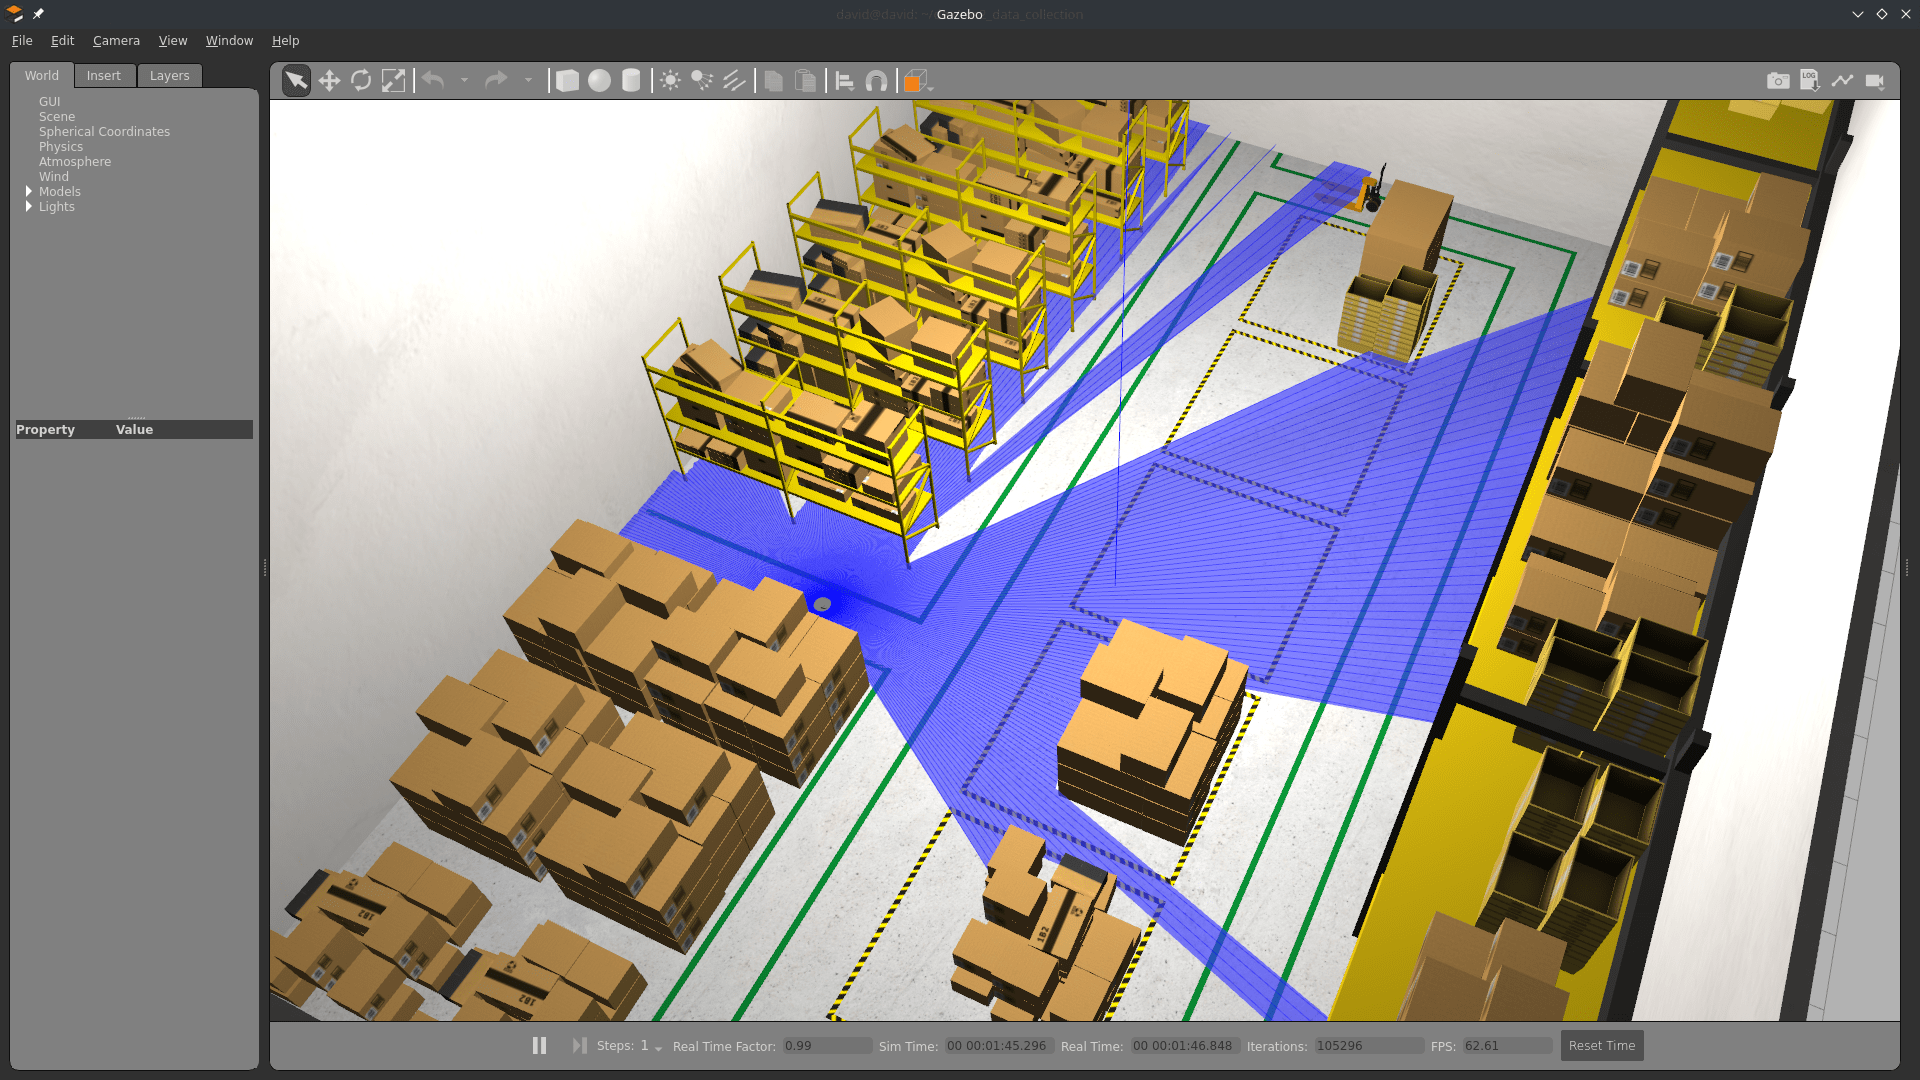
RViz and gz-sim will start: now you see the robot in the warehouse, and the map on RViz. AMCL sets the initial pose itself, so there is no need to click "2D Pose Estimate".
The warehouse world is heavy — 317 model instances. Expect a slow start and a real-time
factor well under 1 without a GPU; see dc_simulation/README.md for measured numbers.
Terminal 2: Start DC
Run colcon build to compile the workspace:
colcon build
Now, start the demo:
ros2 launch dc_demos tb3_simulation_pgsql_minio.launch.py use_sim_time:=True
use_sim_time defaults to False — without the override above, DC's Position
measurement looks up TF transforms on the wall clock while the simulation publishes
them on Gazebo's sim clock, which throws "extrapolation into the past"/"transform does
not exist" errors and can crash measurement_server outright (std::overflow_error in
tf2::Duration) once the two clocks drift far enough apart.
The robot will start collecting data.
Terminal 3: Start autonomous navigation
Execute
ros2 run nav2_simple_commander demo_security
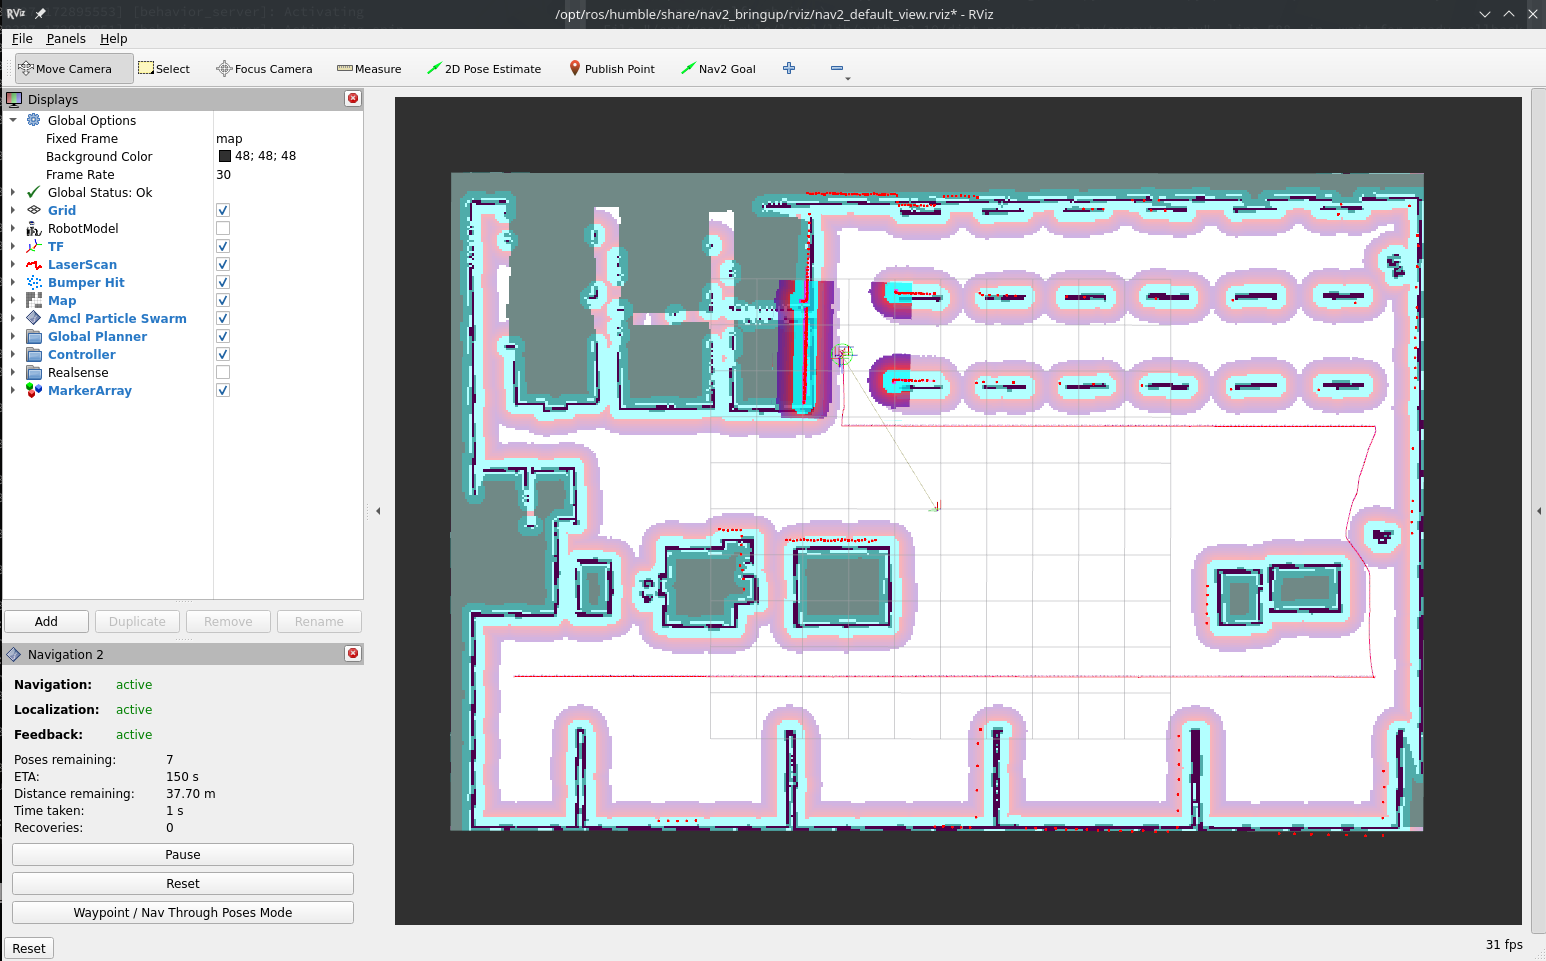
The robot will start moving and you will be able to see all visualizations activated in RViz:
Visualize the data
In the database
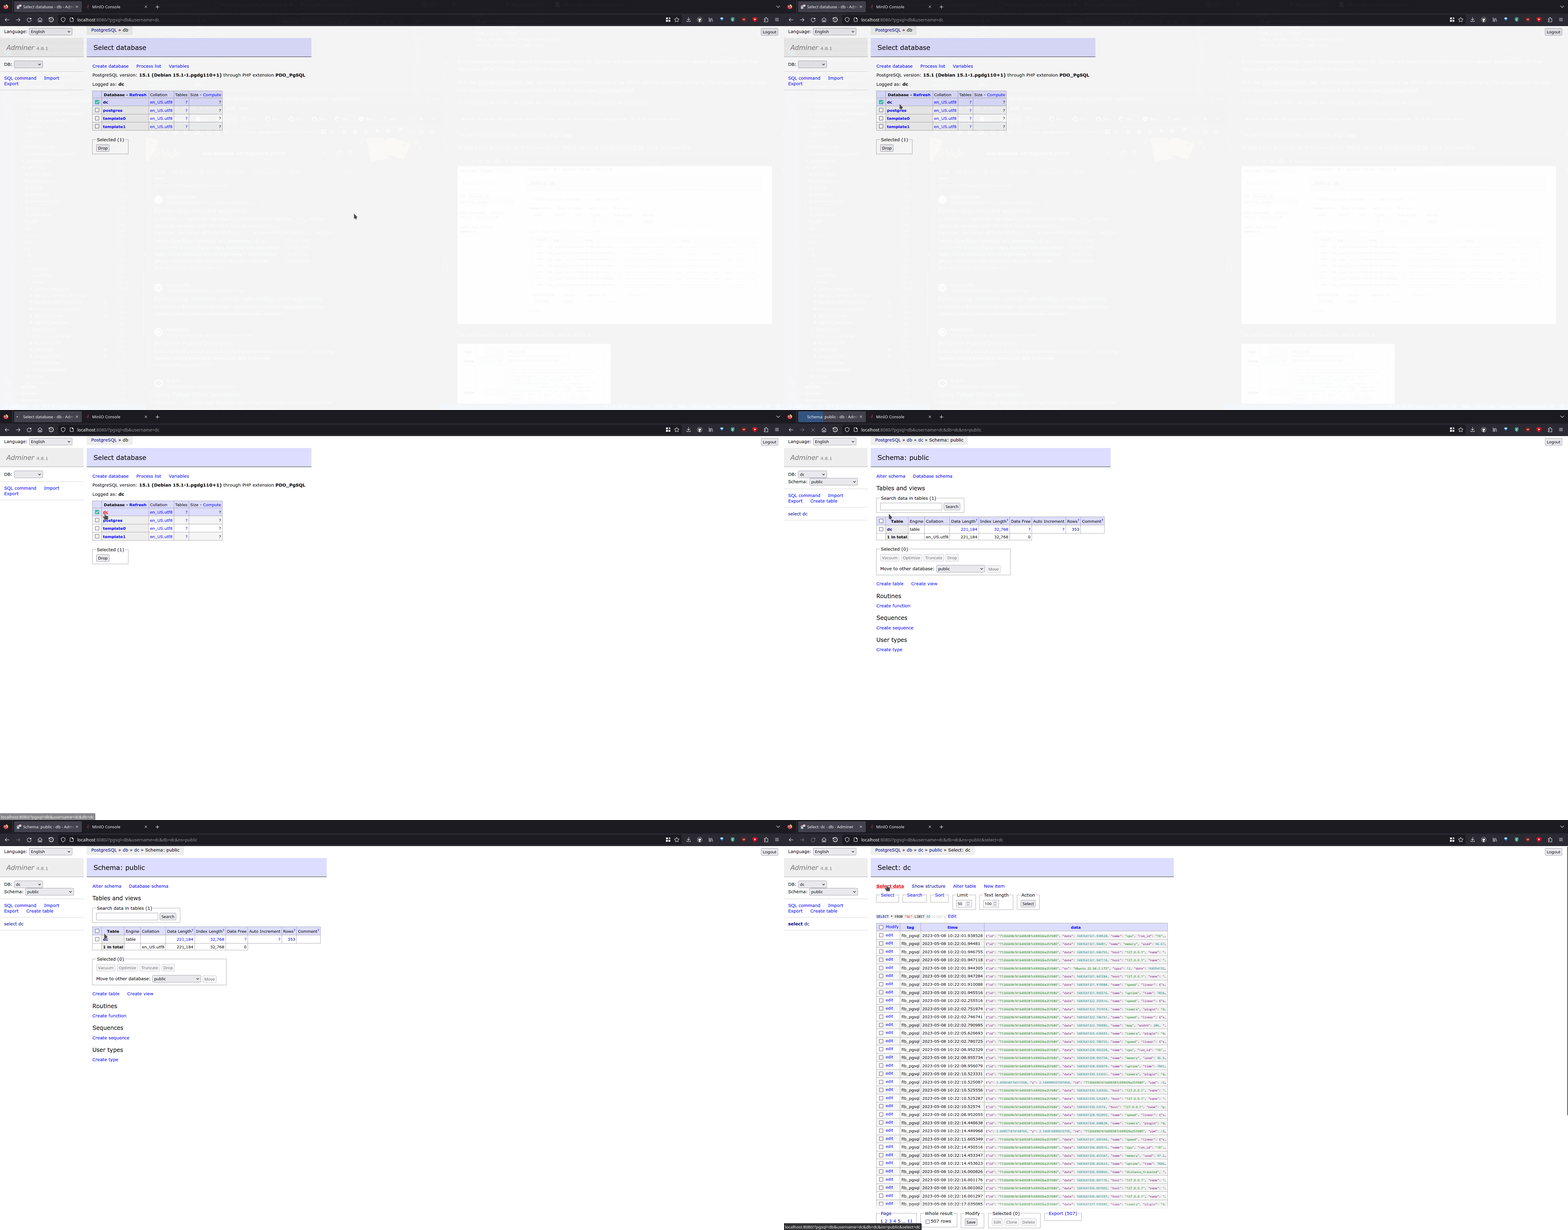
Navigate to localhost:8080
- Select dc database
- Select dc table
- Click on Select data
You will see rows filling the database. You can click on one to see its content:
With Grafana
Four Grafana dashboards ship with the DC 2.0 infrastructure now — Home, Robot, KPI and Fast DDS statistics (the System/Environment/Infrastructure dashboards were dropped as out of scope for this minimal rework). Open http://localhost:3000 (admin/admin) and pick the Robot dashboard: its panels are backed by SQL queries against the dc/dc_files PostgreSQL tables — the Grafana datasource is PostgreSQL (uid dc_postgres) now, not InfluxDB. It shows, among other things, speed/command velocity over time and a table of uploaded inspection files with their RustFS + PostgreSQL upload status:
SELECT to_timestamp(updated_at) AS "time", group_name, robot_name, storage_type, remote_path, content_type, size, uploaded
FROM dc_files WHERE kind = 'file_status' ORDER BY updated_at DESC LIMIT 100
See tools/infrastructure/docker/config/grafana/dashboards/robot.json for every panel's exact query.
The KPI dashboard is the operations view of the same data: availability and uptime per robot over whatever time range the dashboard is set to, computed by the KPI views rather than by any panel query of its own. It populates from this demo's uptime Measurement with no extra configuration.
That's it! Now you can collect your data!
Understanding the configuration
The full configuration file can be found here.
Measurement server
Measurements
measurement_plugins sets which plugin to load. We collect
System measurements:
Robot measurements:
Environment measurements:
Infrastructure measurements:
Each has their own configuration: polling interval, source topic, destination paths, topics used as input etc. Going through each of them would be too long here but you can check for each measurement its documentation and the general documentation of measurements
The old MinIO setup needed two separate TCP health checks — minio_api_health (port 9000) and minio_dashboard_health (port 9001) — because it ran a 4-node MinIO cluster fronted by an nginx console. This demo's single RustFS container exposes only its API port, so it collapses to one rustfs_health check on port 9000; there is no separate console port to probe here.
measurement_server:
  ros__parameters:
    ...
    camera:
      plugin: "dc_measurements/Camera"
      cam_topic: "/intel_realsense_r200_depth/image_raw"
      cam_name: "Intel Realsense"
      save_raw_img: true
      save_raw_path: "camera/raw/%Y-%m-%dT%H-%M-%S"
      remote_prefixes: [""]
      remote_keys: ["rustfs"]
      ...
    map:
      plugin: "dc_measurements/Map"
      save_path: "map/%Y-%m-%dT%H-%M-%S"
      topic_output: "/dc/measurement/map"
      remote_prefixes: [""]
      remote_keys: ["rustfs"]
      ...
    rustfs_health:
      plugin: "dc_measurements/TCPHealth"
      topic_output: "/dc/measurement/rustfs_health"
      polling_interval: 5000
      host: "127.0.0.1"
      port: 9000
      name: "RustFS"
      include_measurement_plugin: true
    pgsql_health:
      plugin: "dc_measurements/TCPHealth"
      topic_output: "/dc/measurement/pgsql_health"
      polling_interval: 5000
      host: "127.0.0.1"
      port: 5432
      name: "PostgreSQL"
      include_measurement_plugin: true
Conditions
We also initialize conditions:
- min_distance_traveled
- max_distance_traveled
They are used in the distance traveled measurement to only take values in a certain range.
Destination server
Here we enable the records_log and rustfs Destinations, plus a passthrough for PostgreSQL:
dc_bridge:
  ros__parameters:
    shipper:
      data_dir: "$HOME/.dc/buffer"
    destinations: ["records_log", "rustfs"]
    records_log:
      type: file
      receives: records
      inputs: [
          # System
          "/dc/measurement/cpu",
          "/dc/measurement/memory",
          "/dc/measurement/os",
          "/dc/measurement/uptime",
          # Robot
          "/dc/measurement/camera",
          "/dc/measurement/cmd_vel",
          "/dc/measurement/distance_traveled",
          "/dc/measurement/driving_type",
          "/dc/measurement/position",
          "/dc/measurement/speed",
          # Environment
          "/dc/measurement/map",
          # Infrastructure
          "/dc/measurement/rustfs_health",
          "/dc/measurement/pgsql_health",
        ]
      path: "/tmp/dc/tb3_simulation_pgsql_minio_records.ndjson"
      time_key: "date"
    rustfs:
      type: s3
      receives: files
      inputs: ["/dc/measurement/map", "/dc/measurement/camera"]
      bucket: "dc-files"
      endpoint: "http://127.0.0.1:9000"
      region: "us-east-1"
      access_key_id: "rustfsadmin"
      secret_access_key: "rustfsadmin"
      force_path_style: true
    files:
      delete_when_sent: true
      metadata_destination: "records_log"
    custom_config_files: ["$HOME/.dc/tb3_simulation_pgsql_minio_sink.toml"]
# ~/.dc/tb3_simulation_pgsql_minio_sink.toml
[sinks.pgsql]
type = "postgres"
inputs = [
  "dc.dc.measurement.cpu", "dc.dc.measurement.memory", "dc.dc.measurement.os",
  "dc.dc.measurement.uptime", "dc.dc.measurement.camera", "dc.dc.measurement.cmd_vel",
  "dc.dc.measurement.distance_traveled", "dc.dc.measurement.driving_type",
  "dc.dc.measurement.position", "dc.dc.measurement.speed", "dc.dc.measurement.map",
  "dc.dc.measurement.rustfs_health", "dc.dc.measurement.pgsql_health",
]
endpoint = "postgres://dc:password@127.0.0.1:5432/dc"
table = "dc"

[sinks.pgsql.buffer]
type = "disk"
max_size = 268435488

[sinks.pgsql_files]
type = "postgres"
inputs = ["dc.dc.files"]
endpoint = "postgres://dc:password@127.0.0.1:5432/dc"
table = "dc_files"

[sinks.pgsql_files.buffer]
type = "disk"
max_size = 268435488
Copy the snippet into place before launching:
mkdir -p ~/.dc && cp "$(ros2 pkg prefix dc_demos)/share/dc_demos/config/tb3_simulation_pgsql_minio_sink.toml" ~/.dc/
PostgreSQL Destinations
PostgreSQL is reached through the ADR-0003
passthrough now, not a blessed postgres Destination — see
Destinations: Recipes. The
passthrough pgsql sink carries almost every measurement and the two infrastructure health
checks as plain Records. Note that not all data needs to go to PostgreSQL — only topics whose
dc.<tag> route exists (i.e. listed in records_log's inputs) reach it.
pgsql_files is a second, dedicated postgres sink in the same passthrough snippet for
dc_uploader's status Records — it has no ROS topic inputs of its own; it consumes the
dc.dc.files route instead, which records_log gains from being named as
files.metadata_destination (that parameter must name a configured receives: records
Destination, so it can't point at a passthrough-only sink id directly). See
Destinations, ADR-0005
and ADR-0014 for the full split, and the
QR codes demo for a worked example of the same pattern.
RustFS Destination
We list only map and camera in rustfs's inputs since those are the only measurements referencing Files. rustfs's type: s3 and receives: files mark it as owned by dc_uploader — a separate process from dc_bridge (ADR-0014) — rather than a Vector sink target: it uploads whatever File the measurement's remote_keys: ["rustfs"] pointed at it, verifies the object landed, and (with files.delete_when_sent: true) deletes the local copy only once that's confirmed. Unlike PostgreSQL, rustfs stays a blessed Destination: receives: files is served entirely by dc_uploader reading these same ROS params, never by a Vector sink, so there is no passthrough equivalent for it to migrate to.