DC

Source code: https://github.com/minipada/ros2_data_collection




| Rolling |
|---|
 |
 |
 |
 |
For detailed instructions, see the navigation sidebar, or browse doc/src/dc on GitHub. Security policy.
Introduction
The DC (Data Collection) project aims at integrating data collection pipelines into ROS 2. The goal is to integrate data collection pipelines with existing APIs to enable data analytics, rather than live monitoring, which already has excellent tools available. As companies increasingly turn to autonomous robots, the ability to understand and improve operations for any type of machine in any environment has become crucial. This involves mostly pick and drop and inspection operations. This framework aims at helping collecting, validating (through JSON schemas) and sending reliably the data to create such APIs and dashboards.
DC uses a modular approach, based on pluginlib and greatly inspired by Nav2 for its architecture. Pluginlib is used to configure which Measurements are collected. Data leaves the robot through the Bridge (dc_bridge), a thin ROS 2 node that renders and supervises an external Shipper, Vector: Vector is a fast, lightweight observability data pipeline, distributed as a single static binary, with native sinks for PostgreSQL, S3-compatible storage, and many more. DC gets its performance, reliability, and data integrity (backpressure handling and disk buffering) without embedding or forking it. Five Destination types are configured natively from ROS parameters; every other Vector sink is reachable by passing raw Shipper configuration through, with no DC code.
Why collect data from robots?
- Performance Monitoring: Collecting data from a robot allows you to monitor its performance and identify areas for improvement. For example, you can use data to analyze the robot's motion and identify areas where it may be experiencing issues or inefficiencies.
- Fault Diagnosis: Data collection can also be used to diagnose faults and troubleshoot issues with the robot. By collecting data on various aspects of the robot's behavior, you can identify patterns or anomalies that may indicate problems with the system.
- Machine Learning: Data collected from robots can be used to train machine learning models, which can be used to improve the robot's performance and behavior. For example, you can use data collected from sensors to train models for object detection or path planning.
- Research and Development: Data collection is important for research and development in robotics. By collecting data on the behavior of robots in different scenarios, researchers can gain insights into how robots can be designed and optimized for different applications.
- Inventory Management: Data collection can be used to monitor inventory levels and track the movement of goods within a warehouse. This can help managers identify which products are in high demand and optimize the placement of products to improve order fulfillment times.
- Resource Allocation: Data collection can also help managers allocate resources more efficiently. For example, by monitoring the movement of people and goods within a warehouse, managers can identify bottlenecks and areas of congestion and adjust staffing and equipment allocation to address these issues.
- Process Improvement: Data collection can be used to monitor and analyze the performance of various processes within a warehouse. By identifying areas of inefficiency or errors, managers can develop strategies for improving these processes and increasing productivity.
- Predictive Maintenance: Data collection can be used to monitor the performance of equipment and identify potential maintenance issues before they occur. This can help managers schedule maintenance more effectively and avoid costly downtime due to equipment failure.
Main features
- Open source: Currently all tools on the market are not open source. This project is in MPL-2.0 license, in summary you can use without asking permission and without paying
- Modular approach: based on pluginlib and greatly inspired by Nav2 for its architecture
- Reliable data collection: validate and send Records to create APIs and dashboards
- Flexible data collection: set polling interval for each Measurement or collect every Measurement with StringStamped messages
- Customizable validation: validate Records using existing or customized JSON schemas
- Easy to extend: add new Measurements by writing a plugin; add new Destinations with configuration alone
- Flexible data collection conditions: collect data based on conditions such as whether the robot is moving or if a field is equal to a value
- Condition-based data collection: collect data when a defined set of combination of all, any, or no condition are met
- Customizable record collection: configure the number of records to collect at the start and when a condition is activated.
- Data inspection: inspect data from camera input including barcode and QR codes
- Fast and efficient: high performance, using an external Shipper for delivery, and designed to minimize code duplication and reduce human errors
- Grouped Measurements: Records can be merged into Groups using the group node, based on the ApproximateTimeSynchronizer
- File uploads: Files —
map_servermaps, camera images, videos, anything a Measurement produces — are uploaded to object storage with verified, resumable transfers, and their metadata is recorded as a Record - Easy to use: designed to be easy to learn and use
- No C++ 3rd party library required: all 3rd party libraries have a vendor package in the repository
And inherited from the Vector shipper:
- Backpressure handling
- Disk buffering, persisting Records across Destination outages and reboots
Here is an example of a pipeline, for an AGV doing pick-and-drop and inspection work:

Security
Found a vulnerability? Do not open a public issue — report it privately through GitHub private vulnerability reporting. The security policy covers the supported branches, the response targets, and what is in scope.
License
This program is under the terms of the Mozilla Public License Version 2.0.
About and Contact
For any inquiry, please contact David (d.bensoussan@proton.me). If your inquiry relates to bugs or open-source feature requests, consider posting a ticket on our GitHub project. If your inquiry relates to configuration support or private feature development, reach out and we will be able to support you in your projects.
Setup
DC 2.0 ships as published container images by default — podman compose or podman run, no ROS 2 toolchain to install locally. It is also an ordinary ROS 2 workspace if
you'd rather build natively: rosdep install, colcon build, done — no forked shipper
to compile, no Go toolchain, nothing needs root.
Containerized
The default, recommended way to run DC — nothing to build, nothing but Podman required.
Quick run
No build needed — the published :rolling images run the all-in-one shape (every ROS
node, the Bridge and the Shipper in one dc-ros container) directly against a local
Postgres, with RustFS available alongside it for a files/S3 Destination. Isolated
network by default — dc-ros reaches the stores by container name, not the host's
network — so the commands below run from deploy/robot/.
podman compose, all three containers, one command — the fastest path if you don't
need to watch each container's own output separately:
podman compose -f compose.aio.yaml -f compose.isolated-network.yaml -f compose.local-destinations.yaml up
podman run, one step at a time — same three containers, split so each command
can be run and checked before the next, in its own terminal:
-
Network and volumes:
podman network create dc_robot_net podman volume create dc_robot_pgdata podman volume create dc_robot_rustfs_data podman volume create dc_robot_aio_buffer -
Postgres, pinned by digest — bump deliberately, check https://hub.docker.com/_/postgres/tags?name=13 for a newer one:
# PostgreSQL 13.23
podman run --rm -it --network dc_robot_net --name dc_robot_postgres \
  -e POSTGRES_USER=dc -e POSTGRES_PASSWORD=password -e POSTGRES_DB=dc \
  -p 5432:5432 -v dc_robot_pgdata:/var/lib/postgresql/data \
  docker.io/library/postgres@sha256:4689940c683801b4ab839ab3b0a0a3555a5fe425371422310944e89eca7d8068
Wait for
database system is ready to accept connectionsbefore moving on. -
RustFS, pinned by digest (matches
compose.local-destinations.yaml— bump deliberately, check https://hub.docker.com/r/rustfs/rustfs/tags for the new one):# RustFS v1.0.0-beta.11 podman run --rm -it --network dc_robot_net --name dc_robot_rustfs \ -p 9000:9000 -v dc_robot_rustfs_data:/data \ docker.io/rustfs/rustfs@sha256:84ce557a0245a06a9aae5516f55ee0f007fca78d41df356f419306fdc0cb168c -
dc-ros— on the isolated network,127.0.0.1no longer reaches Postgres, so this needs a params override pointed at the hostnamepostgresinstead of the image's own baked-in127.0.0.1default:podman run --rm -it --network dc_robot_net --name dc_robot_aio \ -v dc_robot_aio_buffer:/root/.dc/buffer \ -v "$(pwd)/params/aio_params_local.yaml:/opt/dc/dc_params.yaml:ro" \ ghcr.io/minipada/ros2_data_collection/dc-ros:rolling \ dc_params_file:=/opt/dc/dc_params.yaml -
Check Records are landing, from a fourth terminal:
psql -h 127.0.0.1 -U dc -d dc -c 'select * from dc order by date desc limit 5;'Password
password.
See
deploy/robot/README.md
for the three-container split topology, the host-network variant, and trying it against
a real store before fleet rollout.
Building the workspace image
The repository builds a full workspace image with Podman — the same one CI uses:
IMAGE_TAG=dc-workspace:local ./tools/e2e/scripts/build.sh
tools/e2e/scripts/test.sh runs colcon test against that image, and
tools/e2e/scripts/run.sh drives the zero-loss end-to-end harness. See
tools/e2e/README.md.
Deployment renderings and a local Kubernetes loop
deploy/robot/ describes the three-container robot tier (dc-ros, vector,
dc-uploader — see Deployment modes)
as Compose, Podman Quadlet and Kubernetes manifests, for whichever a site already runs. For
iterating on the Kubernetes rendering itself, a loop of plain podman build,
k3d and kubectl commands brings up a disposable local cluster in
seconds — no wrapper script, no registry, just the commands themselves. See
deploy/robot/README.md
for the full command sequence and what each step is for.
k3d's default CNI does not enforce NetworkPolicy, so it cannot validate the fleet's
network-isolation claims. It is the fast inner loop only, deliberately not the
production-parity check.
Native
For developing DC itself, or wherever containers aren't an option.
Requirements
- ROS 2 Rolling (
ros-rolling-ros-baseor larger), on Ubuntu 26.04 or a Debian equivalent colcon,rosdep,git,vcstool(python3-vcstool), a C++17 compiler- x86-64 or aarch64 — the architectures
vector_vendorhas a pinned Vector binary for
Build
-
Clone into a workspace:
mkdir -p ~/ws/src && cd ~/ws/src git clone https://github.com/minipada/ros2_data_collection.git -
Pull in
vector_vendor,aws_sdk_vendorandnlohmann_json_schema_validator_vendor(each its own repo — see ADR-0002's amendment, ADR-0012 andros2_data_collection.repos), register DC's local rosdep rules (header-only C++ libraries upstream rosdistro has no key for), then resolve dependencies:cd ~/ws vcs import src < src/ros2_data_collection/ros2_data_collection.repos echo "yaml file://$PWD/src/ros2_data_collection/rosdep/dc.yaml" \ | sudo tee /etc/ros/rosdep/sources.list.d/10-dc.list rosdep update rosdep install --from-paths src --ignore-src -r -y -
Build:
source /opt/ros/rolling/setup.bash
colcon build
That is the whole install. colcon build also runs vector_vendor, which fetches a
pinned, checksummed Vector release tarball live — the external
Shipper the Bridge supervises at runtime
(ADR-0002) — and aws_sdk_vendor, which
fetches and builds the AWS SDK for C++ (core + s3) dc_uploader uses
(ADR-0014) live from github.com/aws/aws-sdk-cpp
at a pinned tag; both steps need network access
(ADR-0002,
ADR-0012), and aws_sdk_vendor's takes
several minutes the first time.
Python dependencies
Only some Measurement plugins (camera inspection, QR code detection) need Python
packages beyond what ROS 2 installs. rosdep covers the ones with rosdistro keys; for
the rest, uv installs pyproject.toml's pins into a
project virtualenv:
uv sync --no-dev # drop --no-dev to add the tooling and the demo dashboard's packages
Run
source install/setup.bash
ros2 launch dc_bringup dc_bringup.launch.py
The default parameters file (dc_bringup/params/dc_params.yaml) collects uptime and
writes it to a local PostgreSQL Destination. To run your own:
ros2 launch dc_bringup dc_bringup.launch.py dc_params_file:=/path/to/my_params.yaml
See Configuration examples for configurations you can copy, and Destinations for the full Bridge configuration contract.
Useful launch arguments
| Argument | Default | Description |
|---|---|---|
dc_params_file | dc_params.yaml | Parameters file for every DC node |
group_node | False | Start the Group node (needed by any group_server config) |
namespace | "" | Top-level namespace |
log_level | info | Log level for the DC nodes |
autostart | True | Let the lifecycle manager configure and activate the nodes |
use_sim_time | False | Use simulation (Gazebo) clock — set True against a simulator, or TF lookups run on the wall clock while the sim publishes on its own clock and drift into "extrapolation" errors |
run_uploader | True | Launch dc_uploader (ADR-0014) from this process. Set False when it runs in its own container instead (the three-container split) |
What starts, in what order
dc_bringup.launch.py brings the pipeline up deterministically
(ADR-0006): the Bridge
and its Shipper first, then a readiness gate, and only then the collection nodes. If the
Shipper never becomes ready, the launch shuts down loudly instead of collecting data
nowhere. Data Pipeline describes this in full.
Advanced build options
Point the build at a Vector binary you already have instead of downloading one:
colcon build --cmake-args -Dvector_path=/usr/bin/vector
The VECTOR_PATH environment variable does the same thing.
Infrastructure
DC delivers to systems you run yourself. tools/infrastructure/docker/ has compose
files that bring up PostgreSQL and RustFS (S3-compatible object storage) preconfigured
for the demos; see Infrastructure setup.
Issues
If you run into problems building DC, search the issue tracker on GitHub and feel free to open a ticket.
Requirements
Requirements are tracked using Strictdoc.
The goal is to list tasks and do test based requirements.
Demos
We will go together through some demos to get started with DC. You shall find them in the dc_demos package
The demos are grouped in three tiers. Start at Beginner and work down: each demo assumes the concepts explained in the ones before it.
How the tiers work
A demo's tier is the heavier of the two things it asks of you: the infrastructure you
have to run alongside DC, and the DC machinery you have to understand or write. Neither
axis alone is enough — Custom plugin needs no infrastructure
at all but has you writing a C++ Measurement plugin, and
MCAP recording is a single ros2 launch away but is built on
the ADR-0003 passthrough.
| Tier | Infrastructure to run | DC machinery involved |
|---|---|---|
| Beginner | None. Nothing but the built workspace | Measurements and the console Destination (via the ADR-0003 passthrough), configured in YAML |
| Intermediate | At most one stack from tools/infrastructure/docker/, that you start yourself | PostgreSQL/RustFS reached via the ADR-0003 passthrough, or a store with no blessed type at all |
| Advanced | The full inspection stack — PostgreSQL, RustFS and Grafana at once | Code you write yourself, or Measurements, Conditions, Groups, Files and dashboards wired end to end |
When adding a demo, find the heaviest thing it asks of the reader — a service to stand up, or code to write — and file it under the matching tier.
Beginner
Everything prints to your terminal: nothing to install, start or clean up afterwards, and nothing to go and look at in another tool.
Prerequisites: a built and sourced workspace, and nothing else — no containers, no databases. Roughly 5 minutes each, 15 for the Turtlebot3 one including simulator startup.
| Title | Description | Also needs |
|---|---|---|
| Uptime | Collect how long the system has been running and print it on Stdout. Minimal example | — |
| Group memory and uptime | Collect both memory and uptime and group them in a dictionary | — |
| Turtlebot3 Stdout | Collect command velocity, map, position and speed and print it in stdout | The Nav2 Turtlebot3 simulation (see Setup) |
Uptime to stdout
This is the most minimal example to run DC, it collects the system uptime every 5 seconds and sends it to Stdout.
Copy the passthrough sink into place, then run it:
mkdir -p ~/.dc && cp "$(ros2 pkg prefix dc_demos)/share/dc_demos/config/uptime_stdout_sink.toml" ~/.dc/
ros2 launch dc_demos uptime_stdout.launch.py
At the end, the data is displayed. Every Destination — the passthrough console sink
below included — goes through the external Vector Shipper
(ADR-0002, Destinations),
so this is Vector's own event object after ingesting the Record over the Fluent-forward
protocol: source_type, tag, host and timestamp are Vector's, not the Bridge's:
[dc_bridge-2] {"custom_keys":["robot_name","time"],"date":1788476609.152106,"flattened":false,"host":"127.0.0.1","name":"uptime","nested":false,"robot_name":"C3PO","run_id":"169","source_type":"fluent","tag":"dc.measurement.uptime","time":1608993,"timestamp":"2026-09-03T23:03:29.152105868Z"}
[dc_bridge-2] {"custom_keys":["robot_name","time"],"date":1788476614.1494331,"flattened":false,"host":"127.0.0.1","name":"uptime","nested":false,"robot_name":"C3PO","run_id":"169","source_type":"fluent","tag":"dc.measurement.uptime","time":1608998,"timestamp":"2026-09-03T23:03:34.149433151Z"}
[dc_bridge-2] {"custom_keys":["robot_name","time"],"date":1788476619.149286,"flattened":false,"host":"127.0.0.1","name":"uptime","nested":false,"robot_name":"C3PO","run_id":"169","source_type":"fluent","tag":"dc.measurement.uptime","time":1609003,"timestamp":"2026-09-03T23:03:39.149286154Z"}
This launchfile is a wrapper of dc_bringup/launch/dc_bringup.launch.py which loads a custom yaml configuration
Configuration
Measurement
measurement_server:
  ros__parameters:
    measurement_plugins: ["uptime"]
    uptime:
      plugin: "dc_measurements/Uptime"
      topic_output: "/dc/measurement/uptime"
      polling_interval: 5000
      enable_validator: true
      debug: true
      init_collect: true
    custom_key_str_list: ["robot_name", "id"]
    custom_keys_str:
      robot_name:
        name: robot_name
        value: C3PO
      id:
        name: id
        value_from_file: /etc/machine-id
    run_id:
      enabled: true
      counter: true
      counter_path: "$HOME/run_id"
      uuid: false
measurement_plugins (Mandatory): List all the plugins to enable. This is a custom string that is equal to the measurement plugin dictionary present in the same level. If not listed, will not be loaded.
uptime.plugin (Mandatory): Name of the plugin, if you are not sure which plugin is available, use the CLI tool to list them
uptime.polling_interval (Optional): Interval to which data is collected in milliseconds
uptime.enable_validator (Optional): Will validate the data against a JSON schema. This file is located in the dc_measurements package. You can provide your own using the json_schema_path parameter, which we will explore later on
uptime.debug (Optional): More verbose output
uptime.init_collect (Optional): Collect when the node starts instead of waiting for the polling_interval time to pass
run_id.enabled (Optional): Identify which run the robot is. A new one is generated at every start of the node. Uses either a counter that increment at each restart of the node or UUID
run_id.counter (Optional): Enable counter for the run_id
run_id.counter_path (Optional): Path to store the last run. It is expanded with environment variables id
run_id.uuid (Optional): Generate a new run ID by using a random UUID
This will collect the uptime every 5 seconds (including when the node starts), will forward it to the console passthrough sink below.
Inject custom data for each record
Here, we want to append some content in every record: the robot name and its ID. While the robot name comes from a fixed variable in the parameter file, the id comes from the machine-id file.
custom_key_str_list (Optional): Look for those keys in this configuration to add them as keys and values in each record.
custom_keys_str.robot_name (Optional): This parameter is loaded since it is mentioned in custom_key_str_list
custom_keys_str.robot_name.name (Optional): Key in the dictionary to add
custom_keys_str.robot_name.value (Optional): Value associated to the key in the dictionary to add
custom_keys_str.id.name (Optional): Key in the dictionary to add
custom_keys_str.id.value_from_file (Optional): Value associated to the key in the dictionary to add taken from the content of a file
Note that this configuration alone will not display the JSON on stdout since it requires the dc_bridge configuration below
Find the complete measurements documentation here
Destination
dc_bridge:
  ros__parameters:
    shipper:
      data_dir: "$HOME/.dc/buffer"
    destinations: ["records_log"]
    records_log:
      type: file
      receives: records
      inputs: ["/dc/measurement/uptime"]
      path: "/tmp/dc/uptime_stdout_records.ndjson"
      time_key: "date"
      time_format: "double"
    custom_config_files: ["$HOME/.dc/uptime_stdout_sink.toml"]
    vector_forward_host: "127.0.0.1"
    vector_forward_port: 24224
# ~/.dc/uptime_stdout_sink.toml
[sinks.debug_console]
type = "console"
inputs = ["dc.dc.measurement.uptime"]
target = "stdout"

[sinks.debug_console.encoding]
codec = "json"
Destinations
Let's analyze piece by piece. dc_bridge is the single C++ node that owns every Destination; each entry in the destinations list names a section, defined below it, that describes where data goes. We need the topic list on each Destination because the Bridge subscribes to those topics itself and forwards what it receives to an external Vector process over the shipper ingest protocol.
destinations (Mandatory): List all the Destinations to enable. Each name must have a matching section at the same level.
records_log.type (Mandatory): One of the blessed Destination types (postgres, s3, file, console, vector). file writes each Record as a JSON line to path, and is the cheapest anchor to give destinations when the actual output you want comes from a custom_config_files passthrough sink below — dc_bridge derives its ROS subscriptions and dc.<tag> routes from destinations alone, never from a passthrough snippet's inputs. (Printing straight to stdout used a blessed console Destination in earlier versions of this demo; per ADR-0003, console — along with postgres and s3 — has moved to the passthrough recipe below, since it's a pure Vector-sink wrapper with no DC-specific logic. See Destinations: Recipes.)
records_log.receives (Optional): records (default) or files.
records_log.inputs (Mandatory): Topics to which to listen to get the data.
records_log.path (Mandatory for file): Absolute path Vector writes each JSON line to (Vector, not the Bridge, expands this — no $HOME).
records_log.time_format (Optional): Format the data's timestamp will be printed as (epoch_nanos (default), iso8601 or double).
records_log.time_key (Optional): Dictionary key the timestamp is written under.
custom_config_files (Optional): Raw Vector config snippets, merged as-is alongside what dc_bridge itself renders. The uptime_stdout_sink.toml above defines a plain Vector console sink consuming the public dc.dc.measurement.uptime route that records_log's inputs created — this is what actually prints to stdout; records_log itself just writes the same Records to disk as the passthrough's required anchor. See Destinations: Passthrough.
dc_bridge itself needs no engine tuning of the kind the old embedded Fluent Bit shipper required (buffering, scheduler backoff, HTTP stats server, …) — Vector, the external shipper process it forwards to, owns its own on-disk buffering and is configured from the dc_bridge/destinations block above; see ADR-0002 for why that split exists.
Inject run id at each record
Finally, we set the run id. This is used later on when fetching data for a run. It can come from a counter which is incremented at each start of the node or from a random UUID generated. The counter mechanism writes and read on a file on the system (take care of not deleting it), you can set its path as a parameter.
Find the complete destinations documentation here
Console output
Now that the node started, let us see what's displayed in the console.
Measurement server and dc_bridge are started in the Lifecycle, you can read more about it here. Per ADR-0006, the lifecycle manager waits on a bridge_ready_gate before activating the collection nodes:
[INFO] [bridge_ready_gate-3]: process started with pid [31]
[dc_bridge-2] [INFO] [1788478636.751773322] [dc_bridge]: dc_bridge up: 1 subscribed topic(s), supervising /root/ws/install/vector_vendor/lib/vector_vendor/vector
[bridge_ready_gate-3] [INFO] [1788478637.212874385] [bridge_ready_gate]: Bridge is ready: vector is accepting connections
[INFO] [bridge_ready_gate-3]: process has finished cleanly [pid 31]
[INFO] [launch.user]: dc_bridge reports ready; activating collection nodes.
dc_bridge renders the destinations block above into a Vector config and launches (or reloads) the external Vector process pointed at it; bridge_ready_gate only lets the launch continue once Vector is actually accepting connections — see ADR-0002 for why Vector runs as its own process rather than embedded in the Bridge.
Finally, we see the data, now printed by the passthrough console sink rather than by the Bridge itself:
[dc_bridge-2] {"custom_keys":["robot_name","time"],"date":1788476609.152106,"flattened":false,"host":"127.0.0.1","name":"uptime","nested":false,"robot_name":"C3PO","run_id":"169","source_type":"fluent","tag":"dc.measurement.uptime","time":1608993,"timestamp":"2026-09-03T23:03:29.152105868Z"}
[dc_bridge-2] {"custom_keys":["robot_name","time"],"date":1788476614.1494331,"flattened":false,"host":"127.0.0.1","name":"uptime","nested":false,"robot_name":"C3PO","run_id":"169","source_type":"fluent","tag":"dc.measurement.uptime","time":1608998,"timestamp":"2026-09-03T23:03:34.149433151Z"}
[dc_bridge-2] {"custom_keys":["robot_name","time"],"date":1788476619.149286,"flattened":false,"host":"127.0.0.1","name":"uptime","nested":false,"robot_name":"C3PO","run_id":"169","source_type":"fluent","tag":"dc.measurement.uptime","time":1609003,"timestamp":"2026-09-03T23:03:39.149286154Z"}
So...what happened?
- The measurement plugin starts publishing data to /dc/measurement/uptime, which contains the JSON and timestamp of the message
- Run ID and robot_name is appended in the JSON
dc_bridge, which subscribes to this topic directly, receives the data and forwards it to Vector over the shipper ingest protocol- Vector's generated config applies a
remaptransform that writes the configuredtime_keyin the requestedtime_format, and routes the Record onto its publicdc.dc.measurement.uptimeroute - The passthrough
consolesink fromuptime_stdout_sink.toml, consuming that route, prints the JSON to stdout —records_log's ownfilesink writes the same Record to disk in parallel
Group memory and uptime
This demo will introduce the group node. It subscribes to multiple nodes and group for each its data and republishes on a new topic.
Let's run it:
ros2 launch dc_demos group_memory_uptime_stdout.launch.py
[dc_bridge-3] {"date":1788476662.509069,"host":"127.0.0.1","memory":{"flattened":false,"name":"memory","nested":false,"run_id":"169","used":95.77983856201172},"name":"memory_uptime","source_type":"fluent","tag":"dc.group.memory_uptime","tags":[""],"timestamp":"2026-09-03T23:04:22.509068935Z","uptime":{"flattened":false,"name":"uptime","nested":false,"run_id":"169","time":1609047}}
[dc_bridge-3] {"date":1788476665.5074596,"host":"127.0.0.1","memory":{"flattened":false,"name":"memory","nested":false,"run_id":"169","used":95.87796020507812},"name":"memory_uptime","source_type":"fluent","tag":"dc.group.memory_uptime","tags":[""],"timestamp":"2026-09-03T23:04:25.507459531Z","uptime":{"flattened":false,"name":"uptime","nested":false,"run_id":"169","time":1609050}}
[dc_bridge-3] {"date":1788476668.5055394,"host":"127.0.0.1","memory":{"flattened":false,"name":"memory","nested":false,"run_id":"169","used":96.04102325439453},"name":"memory_uptime","source_type":"fluent","tag":"dc.group.memory_uptime","tags":[""],"timestamp":"2026-09-03T23:04:28.505539347Z","uptime":{"flattened":false,"name":"uptime","nested":false,"run_id":"169","time":1609053}}
This launchfile is a wrapper of dc_bringup/launch/dc_bringup.launch.py which loads a custom yaml configuration
Note that here the group node is started. It is one parameter in the launchfile to enable it. In the uptime demo, it is disabled by default because it is not used.
Configuration
Measurement
We collect data from 2 plugins: memory and uptime. The first every second and the latter every 3.
measurement_server:
  ros__parameters:
    measurement_plugins: ["memory", "uptime"]
    memory:
      plugin: "dc_measurements/Memory"
      group_key: "memory"
      topic_output: "/dc/measurement/memory"
      polling_interval: 1000
    uptime:
      plugin: "dc_measurements/Uptime"
      group_key: "uptime"
      topic_output: "/dc/measurement/uptime"
      polling_interval: 3000
Data is now published on 2 ROS topics: /dc/measurement/uptime and /dc/measurement/memory.
The group_key mentioned will be used by the group node to assign a key in the new dictionary
Group
This create a memory_uptime group, subscribes to /dc/measurement/memory and /dc/measurement/uptime topics and republish the result on /dc/group/memory_uptime. The sync_delay allows to wait in a 5 seconds window timeframe the data from each topic before throwing away the data if one topic does not publish it
group_server:
  ros__parameters:
    groups: ["memory_uptime"]
    memory_uptime:
      inputs: ["/dc/measurement/memory", "/dc/measurement/uptime"]
      output: "/dc/group/memory_uptime"
      sync_delay: 5.0
      group_key: "memory_uptime"
include_group_name (Optional, default true): Includes the name of the group in the JSON as a top-level name field — visible in the console output below — which makes it easier later on to fetch the data from your API. Left at its default here.
You can also notice that the group also has a "group_key". It means a group can be part of another.
Destination
Here, we only subscribe to the /dc/group/memory_uptime topic
dc_bridge:
  ros__parameters:
    shipper:
      data_dir: "$HOME/.dc/buffer"
    destinations: ["console"]
    console:
      type: console
      receives: records
      inputs: ["/dc/group/memory_uptime"]
      time_key: "date"
      time_format: "double"
    vector_forward_host: "127.0.0.1"
    vector_forward_port: 24224
Console output
In the terminal, you can see the result, published every 3 seconds (see the date field), which the is timeframe defined by sync_delay and the maximum polling_interval of the measurements.
Finally, note the new dictionary uses the key defined in the group_key measurement_server plugin configuration. They are transferred through the ROS message.
[dc_bridge-3] {"date":1788476662.509069,"host":"127.0.0.1","memory":{"flattened":false,"name":"memory","nested":false,"run_id":"169","used":95.77983856201172},"name":"memory_uptime","source_type":"fluent","tag":"dc.group.memory_uptime","tags":[""],"timestamp":"2026-09-03T23:04:22.509068935Z","uptime":{"flattened":false,"name":"uptime","nested":false,"run_id":"169","time":1609047}}
[dc_bridge-3] {"date":1788476665.5074596,"host":"127.0.0.1","memory":{"flattened":false,"name":"memory","nested":false,"run_id":"169","used":95.87796020507812},"name":"memory_uptime","source_type":"fluent","tag":"dc.group.memory_uptime","tags":[""],"timestamp":"2026-09-03T23:04:25.507459531Z","uptime":{"flattened":false,"name":"uptime","nested":false,"run_id":"169","time":1609050}}
[dc_bridge-3] {"date":1788476668.5055394,"host":"127.0.0.1","memory":{"flattened":false,"name":"memory","nested":false,"run_id":"169","used":96.04102325439453},"name":"memory_uptime","source_type":"fluent","tag":"dc.group.memory_uptime","tags":[""],"timestamp":"2026-09-03T23:04:28.505539347Z","uptime":{"flattened":false,"name":"uptime","nested":false,"run_id":"169","time":1609053}}
Turtlebot3
In this example, we add a robot and start collecting robot data to Stdout.
You will also need 2 terminal windows, to:
- Run the Nav2 turtlebot3 launchfile: it starts localization, navigation and RViz
- Run DC
Since RViz is pretty verbose, using 2 terminal windows will help reading the JSON printed on the terminal window.
Setup the environment
In each, terminal, source your environment and setup turtlebot configuration:
source /opt/ros/rolling/setup.bash
source install/setup.bash
Nothing else has to be exported. Nav2's own nav2_minimal_tb3_sim ships the world, the
robot and its ros_gz_bridge config, and puts them on GZ_SIM_RESOURCE_PATH itself —
the Gazebo Classic GAZEBO_MODEL_PATH and TURTLEBOT3_MODEL variables are gone along
with Classic.
Start Navigation
Then, start the Turtlebot launchfile:
ros2 launch nav2_bringup tb3_simulation_launch.py headless:=False
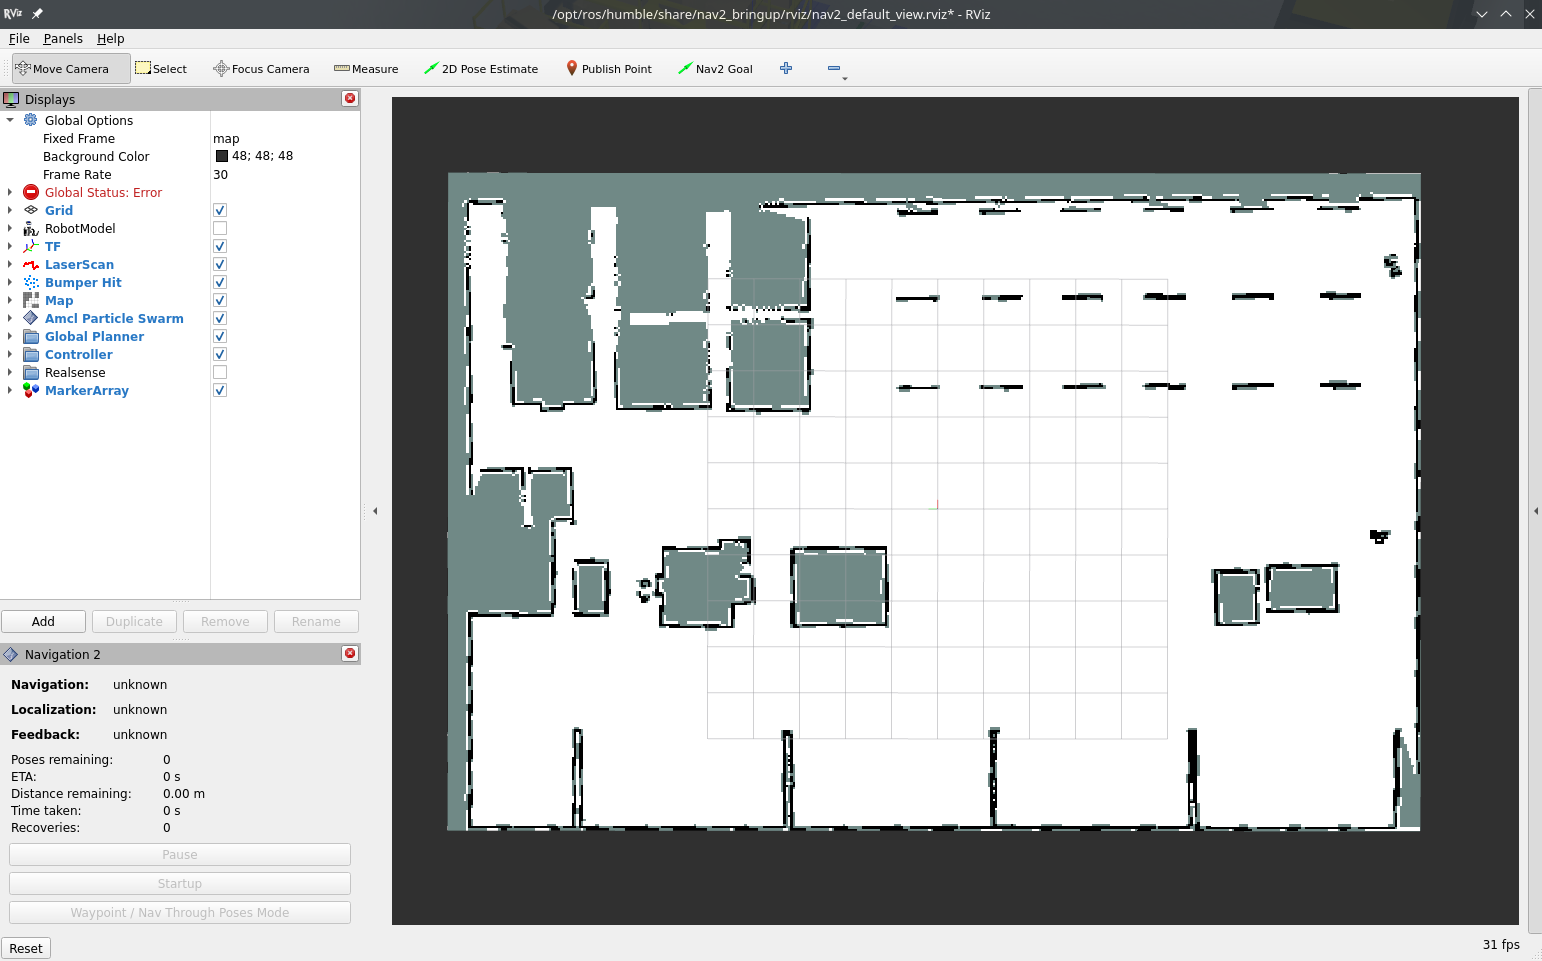
RViz and Gazebo will start: you should now see the robot in Gazebo, and the map on RViz.
Set the robot position using the "2D Pose Estimate" button.
If any problem occur, please take a look at the nav2 official documentation which covers the case.
Start DC
Execute
ros2 launch dc_demos tb3_simulation_stdout.launch.py
At the end, the data is displayed. Every Destination — console included — goes
through the external Vector Shipper (ADR-0002,
Destinations), so
each line below is Vector's own event object, one bare JSON object per line (not an
array):
[dc_bridge-3] {"custom_keys":["robot_name","id"],"date":1788479117.6297202,"flattened":false,"height":384,"host":"127.0.0.1","id":"e110a88ba1c24602bd2c116daf5b8287","local_paths":{"pgm":"/root/dc_data/C3PO/2026/09/03/23/map/2026-09-03T23:45:17.pgm","png":"/root/dc_data/C3PO/2026/09/03/23/map/2026-09-03T23:45:17.png","yaml":"/root/dc_data/C3PO/2026/09/03/23/map/2026-09-03T23:45:17.yaml"},"name":"map","nested":false,"origin":{"x":-10,"y":-10},"resolution":0.05000000074505806,"robot_name":"C3PO","run_id":"170","source_type":"fluent","tag":"dc.measurement.map","timestamp":"2026-09-03T23:45:17.629720410Z","width":384}
[dc_bridge-3] {"cmd_vel":{"angular":{"x":0,"y":0,"z":0.0299867},"computed":0.42023804783821106,"custom_keys":["robot_name","id"],"flattened":false,"id":"e110a88ba1c24602bd2c116daf5b8287","linear":{"x":0.420238,"y":0,"z":0},"name":"cmd_vel","nested":false,"robot_name":"C3PO","run_id":"170"},"date":1788479127.1009243,"host":"127.0.0.1","name":"robot","position":{"custom_keys":["robot_name","id"],"flattened":false,"id":"e110a88ba1c24602bd2c116daf5b8287","name":"position","nested":false,"robot_name":"C3PO","run_id":"170","x":-1.0834591164924419,"y":0.5133007443427651,"yaw":-0.008814692701341621},"source_type":"fluent","speed":{"angular":{"x":0,"y":0,"z":0.027356281873875128},"computed":0.33021257209388344,"custom_keys":["robot_name","id"],"flattened":false,"id":"e110a88ba1c24602bd2c116daf5b8287","linear":{"x":0.33021257209388344,"y":0,"z":0},"name":"speed","nested":false,"robot_name":"C3PO","run_id":"170"},"tag":"dc.group.robot","tags":[""],"timestamp":"2026-09-03T23:45:27.100924197Z"}
Given the JSON is quite large, let's analyze 2 different records:
The first one being the data published on the robot group. Note it's deeply nested now —
each of cmd_vel, position and speed carries its own copy of the custom keys
(robot_name, id, run_id), since those are applied per-measurement before the
group node merges them, not once at the top level:
{
  "cmd_vel": {
    "angular": {
      "x": 0,
      "y": 0,
      "z": 0.0299867
    },
    "computed": 0.42023804783821106,
    "custom_keys": [
      "robot_name",
      "id"
    ],
    "flattened": false,
    "id": "e110a88ba1c24602bd2c116daf5b8287",
    "linear": {
      "x": 0.420238,
      "y": 0,
      "z": 0
    },
    "name": "cmd_vel",
    "nested": false,
    "robot_name": "C3PO",
    "run_id": "170"
  },
  "date": 1788479127.1009243,
  "host": "127.0.0.1",
  "name": "robot",
  "position": {
    "custom_keys": [
      "robot_name",
      "id"
    ],
    "flattened": false,
    "id": "e110a88ba1c24602bd2c116daf5b8287",
    "name": "position",
    "nested": false,
    "robot_name": "C3PO",
    "run_id": "170",
    "x": -1.0834591164924419,
    "y": 0.5133007443427651,
    "yaw": -0.008814692701341621
  },
  "source_type": "fluent",
  "speed": {
    "angular": {
      "x": 0,
      "y": 0,
      "z": 0.027356281873875128
    },
    "computed": 0.33021257209388344,
    "custom_keys": [
      "robot_name",
      "id"
    ],
    "flattened": false,
    "id": "e110a88ba1c24602bd2c116daf5b8287",
    "linear": {
      "x": 0.33021257209388344,
      "y": 0,
      "z": 0
    },
    "name": "speed",
    "nested": false,
    "robot_name": "C3PO",
    "run_id": "170"
  },
  "tag": "dc.group.robot",
  "tags": [
    ""
  ],
  "timestamp": "2026-09-03T23:45:27.100924197Z"
}
This record contains the speed, cmd_vel and position from the group "robot".
{
  "custom_keys": [
    "robot_name",
    "id"
  ],
  "date": 1788479117.6297202,
  "flattened": false,
  "height": 384,
  "host": "127.0.0.1",
  "id": "e110a88ba1c24602bd2c116daf5b8287",
  "local_paths": {
    "pgm": "/root/dc_data/C3PO/2026/09/03/23/map/2026-09-03T23:45:17.pgm",
    "png": "/root/dc_data/C3PO/2026/09/03/23/map/2026-09-03T23:45:17.png",
    "yaml": "/root/dc_data/C3PO/2026/09/03/23/map/2026-09-03T23:45:17.yaml"
  },
  "name": "map",
  "nested": false,
  "origin": {
    "x": -10,
    "y": -10
  },
  "resolution": 0.05000000074505806,
  "robot_name": "C3PO",
  "run_id": "170",
  "source_type": "fluent",
  "tag": "dc.measurement.map",
  "timestamp": "2026-09-03T23:45:17.629720410Z",
  "width": 384
}
This record contains the map data from the measurement. There's no remote_paths key —
this demo's dc_bridge block only declares the console Destination below, not a
rustfs one, so nothing actually matches map.remote_keys: ["rustfs"] and the Bridge
never populates it.
Configuration
Measurement
measurement_server:
  ros__parameters:
    custom_keys_str: ["robot_name"]
    robot_name: "C3PO"
    measurement_plugins: ["cmd_vel", "map", "position", "speed"]
    run_id:
      enabled: true
      counter: true
      counter_path: "$HOME/run_id"
      uuid: false
    save_local_base_path: "$HOME/dc_data/"
    all_base_path: "=robot_name/%Y/%m/%d/%H"
    cmd_vel:
      plugin: "dc_measurements/CmdVel"
      group_key: "cmd_vel"
      enable_validator: true
      topic_output: "/dc/measurement/cmd_vel"
    position:
      plugin: "dc_measurements/Position"
      group_key: "position"
      topic_output: "/dc/measurement/position"
      polling_interval: 1000
      enable_validator: true
      init_collect: true
      global_frame: "map"
      robot_base_frame: "base_link"
      transform_timeout: 0.1
    speed:
      plugin: "dc_measurements/Speed"
      group_key: "speed"
      odom_topic: "/odom"
      topic_output: "/dc/measurement/speed"
    map:
      plugin: "dc_measurements/Map"
      group_key: "map"
      polling_interval: 5000
      save_path: "map/%Y-%m-%dT%H:%M:%S"
      topic_output: "/dc/measurement/map"
      save_map_timeout: 4.0
      remote_prefixes: [""]
      remote_keys: ["rustfs"]
save_local_base_path (Optional): Used as a common base for all saved files from measurement plugins. all_base_path is concatenated to it afterwards for defining the path where files are saved.
all_base_path (Optional): Used as a common base for some measurements to save files. Is concatenated to save_local_base_path. Note the =robot_name, which is later replaced by C3PO (the variable defined in custom_keys_str)
map.remote_keys: creates a dictionary inside remote_paths which is named by the strings in this field — each name must match a receives: files Destination in the dc_bridge block below, so dc_uploader (a separate process from the Bridge, see ADR-0014) knows where to send the file.
Group
group_server:
  ros__parameters:
    groups: ["robot"]
    robot:
      inputs:
        [
          "/dc/measurement/cmd_vel",
          "/dc/measurement/position",
          "/dc/measurement/speed",
        ]
      output: "/dc/group/robot"
      sync_delay: 5.0
      group_key: "robot"
      include_group_name: true
Create a group with data from cmd_vel, position and speed. Even though it appears there is nothing new here, I shall like to precise something important. In the previous demo, we mentioned that if all messages are not received by the group, it will drop it. It matters in this case because cmd_vel is not published all the time in this example (not when it is not moving), this means the data will be collected only when the robot moves (when a controller sends a command).
If you wished to collect the position and the speed constantly, you could take cmd_vel out of this group and add it in the destination.
Destinations
dc_bridge:
  ros__parameters:
    shipper:
      data_dir: "$HOME/.dc/buffer"
    destinations: ["console"]
    console:
      type: console
      receives: records
      inputs: ["/dc/group/robot", "/dc/measurement/map"]
      time_key: "date"
      time_format: "double"
    vector_forward_host: "127.0.0.1"
    vector_forward_port: 24224

measurement_server:
  ros__parameters:
    custom_key_str_list: ["robot_name", "id"]
    custom_keys_str:
      robot_name:
        name: robot_name
        value: "C3PO"
      # Requires systemd package
      id:
        name: id
        value_from_file: /etc/machine-id
Nothing new here, we simply edited the console Destination's inputs to ["/dc/group/robot", "/dc/measurement/map"] to get the data from the robot group and the map.
Console output
Now that the node started, let us see what's displayed in the console. Measurement server and dc_bridge are started in the Lifecycle, you can read more about it here.
"Base save path" and "All Base path" are also saved and expanded. Note "=robot_name" has been replaced by C3PO. measurement_server runs composed inside the same process as every other DC node here, so the prefix is the container's, not the node's own name:
[component_container_isolated-1] [INFO] [1788479023.671013064] [measurement_server]: Base save path expanded to /root/dc_data/
[component_container_isolated-1] [INFO] [1788479023.671095239] [measurement_server]: All Base path expanded to C3PO/%Y/%m/%d/%H
Once dc_bridge reports ready (per ADR-0006's bridge_ready_gate), the measurement plugins and the "robot" group start publishing, and we see the data on Vector's console sink:
[dc_bridge-3] {"custom_keys":["robot_name","id"],"date":1788479117.6297202,"flattened":false,"height":384,"host":"127.0.0.1","id":"e110a88ba1c24602bd2c116daf5b8287","local_paths":{"pgm":"/root/dc_data/C3PO/2026/09/03/23/map/2026-09-03T23:45:17.pgm","png":"/root/dc_data/C3PO/2026/09/03/23/map/2026-09-03T23:45:17.png","yaml":"/root/dc_data/C3PO/2026/09/03/23/map/2026-09-03T23:45:17.yaml"},"name":"map","nested":false,"origin":{"x":-10,"y":-10},"resolution":0.05000000074505806,"robot_name":"C3PO","run_id":"170","source_type":"fluent","tag":"dc.measurement.map","timestamp":"2026-09-03T23:45:17.629720410Z","width":384}
[dc_bridge-3] {"cmd_vel":{"angular":{"x":0,"y":0,"z":0.0131854},"computed":0.17549346387386322,"custom_keys":["robot_name","id"],"flattened":false,"id":"e110a88ba1c24602bd2c116daf5b8287","linear":{"x":0.175493,"y":0,"z":0},"name":"cmd_vel","nested":false,"robot_name":"C3PO","run_id":"170"},"date":1788479126.1020856,"host":"127.0.0.1","name":"robot","position":{"custom_keys":["robot_name","id"],"flattened":false,"id":"e110a88ba1c24602bd2c116daf5b8287","name":"position","nested":false,"robot_name":"C3PO","run_id":"170","x":-1.1893664880015578,"y":0.5148037648787771,"yaw":-0.02119602699838526},"source_type":"fluent","speed":{"angular":{"x":0,"y":0,"z":0},"computed":0,"custom_keys":["robot_name","id"],"flattened":false,"id":"e110a88ba1c24602bd2c116daf5b8287","linear":{"x":0,"y":0,"z":0},"name":"speed","nested":false,"robot_name":"C3PO","run_id":"170"},"tag":"dc.group.robot","tags":[""],"timestamp":"2026-09-03T23:45:26.102085677Z"}
[dc_bridge-3] {"cmd_vel":{"angular":{"x":0,"y":0,"z":0.0299867},"computed":0.42023804783821106,"custom_keys":["robot_name","id"],"flattened":false,"id":"e110a88ba1c24602bd2c116daf5b8287","linear":{"x":0.420238,"y":0,"z":0},"name":"cmd_vel","nested":false,"robot_name":"C3PO","run_id":"170"},"date":1788479127.1009243,"host":"127.0.0.1","name":"robot","position":{"custom_keys":["robot_name","id"],"flattened":false,"id":"e110a88ba1c24602bd2c116daf5b8287","name":"position","nested":false,"robot_name":"C3PO","run_id":"170","x":-1.0834591164924419,"y":0.5133007443427651,"yaw":-0.008814692701341621},"source_type":"fluent","speed":{"angular":{"x":0,"y":0,"z":0.027356281873875128},"computed":0.33021257209388344,"custom_keys":["robot_name","id"],"flattened":false,"id":"e110a88ba1c24602bd2c116daf5b8287","linear":{"x":0.33021257209388344,"y":0,"z":0},"name":"speed","nested":false,"robot_name":"C3PO","run_id":"170"},"tag":"dc.group.robot","tags":[""],"timestamp":"2026-09-03T23:45:27.100924197Z"}
So...what happened?
- The Nav2 turtlebot3 simulation starts, a robot is able to localize and move (once you use the 2-D pose estimate on RViz)
- The measurement plugins start publishing data to /dc/measurement/map, /dc/measurement/cmd_vel, /dc/measurement/position and /dc/measurement/speed, which contain the JSON and timestamp of the message
- In parallel, each time the map plugin sends a ROS message, it also saves the files on the filesystem. Open a file browser to the path you set in the configuration to a path mentioned in the map JSON
- The "robot" group node subscribes to /dc/measurement/cmd_vel, /dc/measurement/position and /dc/measurement/speed and publish on /dc/group/robot when it collects data from all 3 topics
- Run ID and robot_name is appended in the JSON of each
dc_bridge, which subscribes to/dc/group/robotand/dc/measurement/mapdirectly, receives the data and forwards it to the external Vector process over the shipper ingest protocol- Vector's generated config applies a
remaptransform that writes the configuredtime_keyin the requestedtime_format - Vector's
consolesink, the only one matching theconsoleDestination we configured, prints the JSON to stdout
Intermediate
The Records leave the terminal: they land in a database, a search index, a bucket or a file, and you go and read them back there. This is the tier where Destinations — blessed and passthrough — are introduced.
Prerequisites: the Beginner tier, plus the one service each demo sends
to, started from tools/infrastructure/docker/ as described on its Infrastructure
setup page. The two Turtlebot3 demos also need the AWS
warehouse world on top of the simulator. Roughly 20 to 30 minutes each, plus a one-off
container image pull the first time you bring a stack up.
| Title | Description | Also needs |
|---|---|---|
| MCAP recording | Record system data as .mcap via the passthrough Destination and dc_mcap_writer, and open it with ros2 bag info/Foxglove. No robot or simulator needed | No service — just an MCAP viewer (ros2 bag info, Foxglove) to read the result |
| Elasticsearch | Send system data to Elasticsearch via the passthrough Destination, and look at it in Kibana. No robot or simulator needed | Elasticsearch + Kibana |
| Turtlebot3 AWS Warehouse RustFS PostgreSQL | Collect system, robot, environment and infrastructure data and send it to RustFS and PostgreSQL | PostgreSQL + RustFS, and the AWS warehouse world |
| Turtlebot3 AWS Warehouse InfluxDB | Collect system, robot, environment and infrastructure data and send it to InfluxDB via the passthrough Destination | InfluxDB, and the AWS warehouse world |
MCAP recording (passthrough)
dc_bridge blesses exactly five Destination types — postgres, s3, file, console,
vector (see Destinations) — and MCAP is not one of them; Vector, the
Shipper, has no MCAP sink at all. This tutorial is the worked example for #210: the
ADR-0003 passthrough plus a
small standalone process, dc_mcap_writer
(ADR-0009),
that consumes the same public dc.<tag> routes a blessed Destination consumes and
writes them as rotated .mcap files, ready to open with ros2 bag info or
Foxglove.
Unlike the Elasticsearch/InfluxDB
passthrough demos, there is no raw Vector TOML to hand-author and no second terminal to
start a companion process in: dc_bringup.launch.py reads a dc_mcap_writer: block
from the same params file every other node's parameters live in, generates the
passthrough sink from it, and starts dc_mcap_writer itself automatically. From the
params file it looks like configuring a Destination — one block, inputs, done —
even though it structurally isn't one (see "Understanding the configuration" below for
why).
Each Record is written as a JSON-schema-encoded MCAP message — one Channel per Tag,
schema {"type": "object"} — the pattern in the
foxglove/mcap jsonschema/writer.cpp
example issue #210 links to. This is not a ros2 bag record capture of typed ROS
messages: Records are DC's own JSON payloads, not (de)serialized ROS message types, so
there is nothing to generate .msg/.idl schemas from. ros2 bag info reads the
file's Channel/Statistics records regardless of encoding; Foxglove additionally
understands jsonschema channels well enough to plot and inspect fields directly.
Run it
Hardware-free: four system Measurements, one dc_mcap_writer: block in the params
file (dc_demos/params/mcap_recording.yaml), one launch command:
colcon build
ros2 launch dc_demos mcap_recording.launch.py
dc_bringup.launch.py starts dc_mcap_writer before the rest of the stack, so its TCP
listener is up before Vector's generated socket sink (re)connects to it — the very
first Record lands instead of relying on Vector's own retry. The records_log file
Destination writes every Record as it is shipped to /tmp/dc/mcap_recording_records.ndjson,
so tail -f on that path doubles as a local view of what dc_mcap_writer is receiving
(an earlier version of this demo used a blessed console Destination for the same job —
see Destinations: Recipes
for why that moved to a passthrough recipe); dc_mcap_writer's own log lines (on this
terminal — it runs alongside dc_bridge, not in the background) show each file it opens
and closes.
Verify the recording
Stop the stack (Ctrl-C) once a few Records have been collected — dc_mcap_writer
finishes the file it has open on shutdown, so every .mcap under the configured
output_dir (~/dc_mcap_out in the demo params) is independently valid, including every
earlier rotation:
ros2 bag info ~/dc_mcap_out/records_<timestamp>_<pid>_0001.mcap
Files:             /root/dc_mcap_out/records_20260904T064025Z_40_0001.mcap
Bag size:          3.8 KiB
Storage id:        mcap
ROS Distro:        unknown
Duration:          9.998903549s
Start:             Sep  4 2026 06:40:26.274123868 (1788504026.274123868)
End:               Sep  4 2026 06:40:36.273027417 (1788504036.273027417)
Messages:          10
Topic information: Topic: dc.measurement.cpu | Type: dc/record | Count: 3 | Serialization Format: json
                    Topic: dc.measurement.memory | Type: dc/record | Count: 3 | Serialization Format: json
                    Topic: dc.measurement.os | Type: dc/record | Count: 1 | Serialization Format: json
                    Topic: dc.measurement.uptime | Type: dc/record | Count: 3 | Serialization Format: json
Service:           0
Service information:
Type: dc/record — not unknown — because dc_mcap_writer registers its JSON-schema
Channels under that schema name (writer.py's register_schema(name="dc/record", ...));
ros2 bag info shows it verbatim rather than resolving a ROS message type, since there
isn't one. Message counts and per-topic breakdown come from the file's
Statistics/Channel records regardless. Also note the topic name is dc.measurement.cpu,
not dc.dc.measurement.cpu — a single dc. prefix, matching the dc.<tag> routing
contract in Destinations.
Opening the same file in Foxglove Studio (Open local
file…) lists each dc.<tag> Channel and renders its JSON fields (cpu.average,
memory.used, uptime.time, …) in the Raw Messages and Plot panels like any other
topic.
Rotation
dc_mcap_writer rotates to a new .mcap file once the current one hits max_bytes
(default 128 MiB) or has been open max_duration_secs (default 300s), whichever comes
first — the same "whichever limit first" shape used for files.retention
(ADR-0005),
applied here to dc_mcap_writer's own output rather than dc_uploader's intent queue
(ADR-0009 explains why this stays
outside dc_bridge). Filenames are
<prefix>_<UTC timestamp>_<pid>_<rotation index>.mcap; the PID and counter together
guarantee a unique name even across a process restart landing in the same wall-clock
second as the previous process's last rotation — without both, the new process could
compute the identical name and its open(..., "wb") would silently truncate the file
the previous process had already finished.
A .mcap file only becomes readable once its rotation finishes — writing the file's
closing footer is what max_bytes/max_duration_secs triggers, not something every
individual Record write does. A process that never gets to shut down gracefully
(SIGKILL, or a container/orchestrator grace period too short for the clean-shutdown
path to complete) loses whatever is in the file still open at that moment; every
already-finished rotation stays valid and readable regardless. max_duration_secs's
default balances this against not producing too many small files — lower it for
tighter durability, raise it for fewer files, per your own tolerance for that
loss window.
Understanding the configuration
See the Elasticsearch tutorial for the full
ADR-0003 passthrough
mechanics — routing, buffering, the dc.<tag> contract. This section only covers
what's specific to how MCAP recording is wired up.
dc_demos/params/mcap_recording.yaml's dc_mcap_writer: block is not nested
inside dc_bridge's destinations list, and can't be made to look exactly like
postgres/s3/file/console/vector there: destinations is parsed and validated by
dc_bridge itself, in C++, and an unrecognized type is a hard startup error by
design (see Destinations) — teaching it a sixth type would mean
changing dc_bridge, which ADR-0009
explicitly decided against (Vector's own
at-least-once/disk-buffered guarantees already cover what would have justified that).
So it's a sibling top-level block instead, structurally shaped like a Destination
(inputs, a handful of scalar settings) without literally being one.
dc_bringup.launch.py's build_bridge_and_mcap_actions() reads that block at launch
time (not compiled in — editing the params file and relaunching is how you change it)
and, when enabled: true:
- Renders a Vector
socketsink (mode = "tcp",encoding.codec = "json",framing.method = "newline_delimited") frominputs, converting each ROS topic to its publicdc.<tag>route the same way the Bridge itself does, to~/.dc/generated_mcap_sink.toml— regenerated every launch, not meant to be hand-edited — and merges that path into whateverdc_bridge.custom_config_filesthe params file already lists (a secondparameters=[...]entry for a list-valued ROS parameter replaces the file's value rather than appending to it, so this merge has to happen in the launch file's own Python, not by relying onlaunch_ros). - Starts
dc_mcap_writeras a plainExecuteProcess— deliberately notros2 run dc_mcap_writer dc_mcap_writer:ros2 runspawns its target as a child of its own process and does not forward signals to it, solaunch's own respawn/shutdown handling would only ever reach theros2 runwrapper, leaving the realdc_mcap_writerprocess running, orphaned, never getting the chance to finish its currently-open.mcapfile.dc_mcap_writerhas norclpy/ROS-node dependency of its own, so nothing here actually needsros2 run's node-launching machinery — a sourced workspace already puts it onPYTHONPATH, sopython3 -m dc_mcap_writer.cliruns it directly.
Like every passthrough sink, the generated Vector sink gets Vector's default in-memory
buffer, not the disk buffer blessed sinks get — see the "Passthrough:
custom_config_files" section of Destinations.
dc_mcap_writer itself routes each incoming Record to a Channel by its tag field
(falling back to name, then a fixed dc.unknown catch-all), and reads the Record's
normalized timestamp from its own --time-key (default date, matching the Bridge's
own time_key parameter — not currently exposed as its own dc_mcap_writer: field,
set it via ros2 launch's underlying ExecuteProcess if you need a non-default value)
to set the MCAP message's log_time/publish_time — it understands all three
time_format values (epoch_nanos, iso8601, double), same as
documented for Destinations.
Running dc_mcap_writer outside dc_bringup
The launch integration above covers the common case; python3 -m dc_mcap_writer.cli
(see --help) is still the standalone entrypoint underneath it, useful for converting
an existing NDJSON capture (--stdin) or running it against a hand-authored passthrough
snippet the way the Elasticsearch tutorial shows for other sinks.
Elasticsearch (passthrough)
dc_bridge blesses exactly five Destination types — postgres, s3, file, console,
vector (see Destinations) — and Elasticsearch is not one of them. This
tutorial is the worked example for reaching everything else: the
ADR-0003 passthrough,
a raw Vector config snippet loaded through custom_config_files
that consumes the same public dc.<tag> routes a blessed Destination consumes. Nothing in
dc_bridge knows what Elasticsearch is, and no DC code was written to support it.
Elasticsearch is the example because it is the one most often asked for, but the shape generalises: swap the sink type and you have Kafka, Loki, ClickHouse, Datadog, or anything else in Vector's catalog. The InfluxDB demo is the same mechanism against a Turtlebot3 simulation; this page needs no simulator and no robot — four system Measurements, one compose file, one terminal.
Setup the infrastructure
Start Elasticsearch and Kibana by following the steps:
podman compose -f tools/infrastructure/docker/docker-compose.elasticsearch.yaml up -d
Confirm the cluster is up before launching DC — the sink retries a store that isn't there
yet, but a green cluster makes the first Record land immediately:
curl -s http://localhost:9200/_cluster/health
One-time: install the passthrough sink config
Because there is no Elasticsearch Destination to configure through ROS parameters, the
Vector sink itself ships as a plain file in this package,
dc_demos/config/elasticsearch_sink.toml, installed to the package's share directory.
Copy it into place once before the first launch:
mkdir -p ~/.dc
cp "$(ros2 pkg prefix dc_demos)/share/dc_demos/config/elasticsearch_sink.toml" ~/.dc/
The params file's custom_config_files points at that path. Editing the copy in ~/.dc/
is how you change the sink — it is read at Bridge startup, not compiled in.
Run it
colcon build
ros2 launch dc_demos elasticsearch.launch.py
The file Destination writes every Record as it is shipped to /tmp/dc/elasticsearch_records.ndjson,
so tail -f on that path doubles as a local view of what Elasticsearch is receiving:
{"cpu":{"average":0,"processes":9,"sorted":[]},"custom_keys":["robot_name"],"date":1788504548.4015868,"flattened":false,"host":"127.0.0.1","name":"cpu","nested":true,"robot_name":"C3PO","run_id":"170","source_type":"fluent","tag":"dc.measurement.cpu","timestamp":"2026-09-04T06:49:08.401586806Z"}
{"custom_keys":["robot_name"],"date":1788504548.404685,"flattened":false,"host":"127.0.0.1","memory":{"used":96.89765167236328},"name":"memory","nested":true,"robot_name":"C3PO","run_id":"170","source_type":"fluent","tag":"dc.measurement.memory","timestamp":"2026-09-04T06:49:08.404685157Z"}
{"custom_keys":["robot_name"],"date":1788504548.4057963,"flattened":false,"host":"127.0.0.1","name":"uptime","nested":true,"robot_name":"C3PO","run_id":"170","source_type":"fluent","tag":"dc.measurement.uptime","timestamp":"2026-09-04T06:49:08.405796359Z","uptime":{"time":1636933}}
Visualize the data
With curl
The sink writes one index per UTC day, so dc-records-* is every day's data:
curl -s 'http://localhost:9200/dc-records-*/_count'
{"count":25,"_shards":{"total":1,"successful":1,"skipped":0,"failed":0}}
Count the documents per Measurement — cpu, memory and uptime poll every 5 seconds,
while os is configured to collect once (init_max_measurements: 1), which is exactly
what shows up:
curl -s -H 'Content-Type: application/json' 'http://localhost:9200/dc-records-*/_search' \
  -d '{"size":0,"aggs":{"by_name":{"terms":{"field":"name.keyword"}}}}'
"buckets": [
  { "key": "cpu",    "doc_count": 8 },
  { "key": "memory", "doc_count": 8 },
  { "key": "uptime", "doc_count": 8 },
  { "key": "os",     "doc_count": 1 }
]
And one document in full:
curl -s -H 'Content-Type: application/json' 'http://localhost:9200/dc-records-*/_search' \
  -d '{"size":1,"query":{"term":{"name.keyword":"os"}}}'
{
  "@timestamp": "2026-08-07T15:47:09Z",
  "custom_keys": ["robot_name"],
  "date": 1786117629.0,
  "flattened": false,
  "host": "127.0.0.1",
  "name": "os",
  "nested": true,
  "os": {
    "cpus": 8,
    "kernel": "6.12.96+deb13-amd64",
    "memory": 23.23,
    "os": "Ubuntu 24.04.4 LTS"
  },
  "robot_name": "C3PO",
  "run_id": "1",
  "source_type": "fluent",
  "tag": "dc.measurement.os",
  "timestamp": "2026-08-07T15:47:09Z"
}
The Record's own fields (os.*, date, robot_name, run_id) are joined by four the
Shipper adds: tag — the Tag
the Record was routed under, useful as a filter — plus host, source_type and
timestamp from Vector's ingest source. @timestamp is added by the snippet; see below.
With Kibana
Open http://localhost:5601, then Stack Management → Data Views → Create data view:
| Field | Value |
|---|---|
| Name | dc |
| Index pattern | dc-records-* |
| Timestamp field | @timestamp |
Discover then shows Records as they arrive, and cpu.average, memory.used and
uptime.time are all numeric fields ready to chart in Lens — no mapping to declare,
because Elasticsearch inferred it from the first document of each index.
Understanding the configuration
Measurements
Four system Measurements, none of which need hardware, a simulator, or a running robot:
measurement_server:
  ros__parameters:
    measurement_plugins: ["cpu", "memory", "os", "uptime"]
    cpu:
      plugin: "dc_measurements/Cpu"
      topic_output: "/dc/measurement/cpu"
      polling_interval: 5000
      include_measurement_name: true
      init_collect: true
      max_processes: 5
      cpu_min: 5.0
      nested: true
      flatten: false
The one destination-specific choice here is flatten: false. With nested: true the
Measurement wraps its values under its own key; flatten then decides whether that
structure is collapsed into keys like /cpu/average (what the InfluxDB and PostgreSQL
demos use, because a line-protocol or column-shaped store wants flat fields) or left as
real nested JSON. Elasticsearch stores JSON natively and maps a nested object to dotted
field names on its own, so leaving it nested gives you cpu.average — a field Kibana can
aggregate — instead of a literal field named /cpu/average, which every KQL query would
have to escape.
Destination: what actually creates the routes
This is the part of the passthrough that surprises people:
dc_bridge:
  ros__parameters:
    shipper:
      data_dir: "$HOME/.dc/buffer"
    destinations: ["records_log"]
    records_log:
      type: file
      receives: records
      inputs:
        [
          "/dc/measurement/cpu",
          "/dc/measurement/memory",
          "/dc/measurement/os",
          "/dc/measurement/uptime",
        ]
      path: "/tmp/dc/elasticsearch_records.ndjson"
      time_key: "date"
      time_format: "double"
    custom_config_files: ["$HOME/.dc/elasticsearch_sink.toml"]
    vector_forward_host: "127.0.0.1"
    vector_forward_port: 24224
destinations still names a blessed Destination, and it is not decoration.
dc_bridge derives two things from destinations and nothing else:
- which ROS topics it subscribes to, and
- which
dc.<tag>route branches exist in the Vector config it renders.
It never reads a passthrough snippet's inputs. So a topic that appears only in the
snippet is a topic the Bridge never subscribes to and never routes — the snippet's
inputs would resolve to routes that don't exist. Every topic you want in Elasticsearch
must therefore appear in some blessed Destination's inputs too.
file is the anchor here — it needs no infrastructure and no credentials, and writes
path to disk rather than your terminal. An earlier version of this demo used a
blessed console Destination for the same job (console also gave you a local view of
what was landing in Elasticsearch), but per ADR-0003
console — along with postgres and s3 — has since moved to the passthrough recipe
itself, being a pure Vector-sink wrapper with no DC-specific logic; see
Destinations: Recipes
for that recipe if you still want a terminal echo alongside Elasticsearch.
destinations: [] does not work. rclcpp cannot load an empty YAML sequence (it has no
inferable element type), so the Bridge dies at startup with parameter_value_from failed for parameter 'destinations': No parameter value set and never gets as far as reading
custom_config_files. A passthrough always accompanies at least one blessed Destination.
The passthrough snippet
[transforms.elasticsearch_prepare]
type = "remap"
inputs = [
  "dc.dc.measurement.cpu",
  "dc.dc.measurement.memory",
  "dc.dc.measurement.os",
  "dc.dc.measurement.uptime",
]
source = '''
."@timestamp" = .timestamp

.doc_id = sha2(
  to_string!(.tag) + "|" + to_string!(.date) + "|" + to_string!(.run_id),
  variant: "SHA-256"
)
'''

[sinks.elasticsearch]
type = "elasticsearch"
inputs = ["elasticsearch_prepare"]
endpoints = ["http://127.0.0.1:9200"]
api_version = "v8"
mode = "bulk"
bulk.index = "dc-records-%Y.%m.%d"
bulk.action = "index"
id_key = "doc_id"

[sinks.elasticsearch.buffer]
type = "disk"
max_size = 268435488
Each inputs entry is one of the stable dc.<tag> routes. The Tag is the topic name with
the leading / dropped and the remaining / turned into . (/dc/measurement/cpu →
dc.measurement.cpu), and the route is dc.<tag> — so dc.dc.measurement.cpu. These
names are public API; see
Destinations.
Note that a snippet is not limited to sinks. elasticsearch_prepare is a transform, and
it is merged into the topology like any other component — the only rule is that a snippet
must not define a component id the generated config owns (dc_bridge_in,
dc_bridge_normalize, dc, or a configured Destination's name). Consuming those ids is
fine; redefining one is a loud Bridge startup error naming the file.
Four things in there are worth explaining, because three of them are what separate a snippet that works from a snippet that works and survives contact with a real deployment:
."@timestamp" = .timestamp — Elasticsearch's convention for a document's time field
is @timestamp, and Kibana offers it as the default when you create a data view. Vector
calls it timestamp. This copies it across. Copy, not move: bulk.index is a strftime
template rendered from the event's own timestamp, and deleting that field makes every
document fail to render an index name and get dropped.
bulk.index = "dc-records-%Y.%m.%d" — one index per UTC day, the usual shape for
time-series data. dc-records-* is then a single Kibana data view, and expiring old data
is deleting whole indices rather than running delete-by-query.
id_key + a deterministic doc_id — the Shipper is at-least-once
(ADR-0002). After an
outage, Records that were in flight when it started are re-sent on recovery, and with
Elasticsearch's default auto-generated _id every re-send becomes a new document.
Hashing (Tag, Record timestamp, run id) into a stable id makes the write an upsert instead,
so a re-delivery overwrites its earlier copy. Vector moves the doc_id field into the
document's _id rather than storing it in the body.
The disk buffer — dc_bridge gives every blessed sink a disk buffer, but a
passthrough sink gets Vector's default, which is in-memory and 500 events deep. That is
not a correctness problem (see below), but a shallow buffer starts applying backpressure
within seconds of a store going away, which is what turns a short outage into a large
burst of re-deliveries. max_size is in bytes and Vector rejects anything below ~256 MiB;
the buffer lives under the Bridge's own shipper.data_dir.
What happens when Elasticsearch goes away
Worth doing once, because it is the question every passthrough raises — the Bridge's durability guarantees are documented for blessed Destinations, and it is reasonable to wonder whether a sink DC knows nothing about still gets them.
Leave DC running and stop the store for two minutes:
podman stop elasticsearch
# ...wait...
podman start elasticsearch
Vector logs the failure and retries with exponential backoff, so the terminal fills with:
WARN sink{component_id=elasticsearch component_type=elasticsearch}: vector::sinks::util::retries: Retrying after error. error=Failed to make HTTP(S) request: error trying to connect: tcp connect error: Connection refused (os error 111)
WARN sink{component_id=elasticsearch component_type=elasticsearch}: vector::sinks::util::service::health: Endpoint is unhealthy. endpoint=http://127.0.0.1:9200
uptime.time increases by exactly 5 every Record, which makes gaps and duplicates
countable. Across a 2-minute outage, with the sink above, all 110 Records spanning the
outage arrive: none missing, none duplicated.
Two things produced that result, and both are choices in the snippet rather than anything DC does for you:
- No loss comes from the Shipper's end-to-end acknowledgements.
dc_bridgeholds a Record until Vector confirms it, so a full buffer means the Bridge retries rather than drops — this part you get for free, disk buffer or not. - No duplicates comes from the deterministic
_id. Running the same outage with Vector's default in-memory buffer and Elasticsearch's auto-generated ids also loses nothing, but indexes each Record up to a dozen times: backpressure hits within seconds, the Bridge re-sends unacknowledged Records, and every re-send lands as its own document.
Recovery is not instant. Vector's retry backoff grows to roughly a minute between attempts, so after a long outage the backlog starts draining up to a minute after the store comes back, then catches up quickly.
Adapting it
- Another store. Replace
[sinks.elasticsearch]with any other type from Vector's sink catalog. Theinputs, the blessed-Destination requirement, and the at-least-once caveat are the same; only the sink block changes. - A real robot's data. Add the topics to both the blessed Destination's
inputsand the snippet's. The Turtlebot3 AWS Warehouse params file is a good source of Measurement configuration to copy from. - A secured cluster. Add an
authblock to the sink — there is a commented example at the bottom ofelasticsearch_sink.toml. Vector expands$VARreferences in its own config at startup, so the password can come from the environment.
Cleanup
podman compose -f tools/infrastructure/docker/docker-compose.elasticsearch.yaml down -v
Turtlebot3
In this example, we add a robot and start collecting robot data to Stdout.
You will also need 3 terminal windows, to:
- Run the Nav2 turtlebot3 launchfile: it starts localization, navigation and RViz
- Run navigation inspection demo
- Run DC
Using a different terminal window for DC helps reading its information.
Setup the environment
Python dependencies
For this tutorial, we will need to install all dependencies, the demo dashboard's included (uv owns them; see Setup):
uv sync
Setup Infrastructure
RustFS
RustFS will be used as storage for images and other files. To start it, follow the steps — a single RustFS container plus a one-shot container that bootstraps the dc-files bucket, using the default rustfsadmin/rustfsadmin credentials this demo's params file already assumes. No manual bucket or key setup is needed, unlike the old 4-node MinIO cluster + nginx console this replaces.
PostgreSQL
PostgreSQL will be used as database storage for our JSON. Later on, backend engineers can make requests on those JSON based on measurement requested and time range. To start it, follow the steps
The default yaml configuration file does not need change as it also uses default values.
tools/infrastructure/docker/config/postgresql/init.sql pre-creates the dc and dc_files tables Vector's postgres sink writes into — it maps each Record's top-level JSON keys onto existing columns of the same name rather than creating them itself. See the file's header comment for the full column reference.
Setup simulation environment
In the terminal 1, source your environment:
source /opt/ros/rolling/setup.bash
source install/setup.bash
Nothing else has to be exported. dc_simulation puts its own models and worlds on
GZ_SIM_RESOURCE_PATH through its environment hook.
This demo used to run aws_robomaker_small_warehouse_world under Gazebo Classic. That
package has no Jazzy release — its own jazzy branch still hard-depends on gazebo_ros,
which was never published for Jazzy. The warehouse now comes from dc_simulation
instead, which vendors the same AWS RoboMaker props (shelves, clutter, trash cans) into
a gz-sim world of its own.
Terminal 1: Start Navigation
Then, in the same terminal (1), start the simulation and Nav2. DC comes up separately in terminal 2, so turn it off here:
ros2 launch dc_demos tb3_qrcodes.launch.py \
    headless:=False \
    use_dc:=False
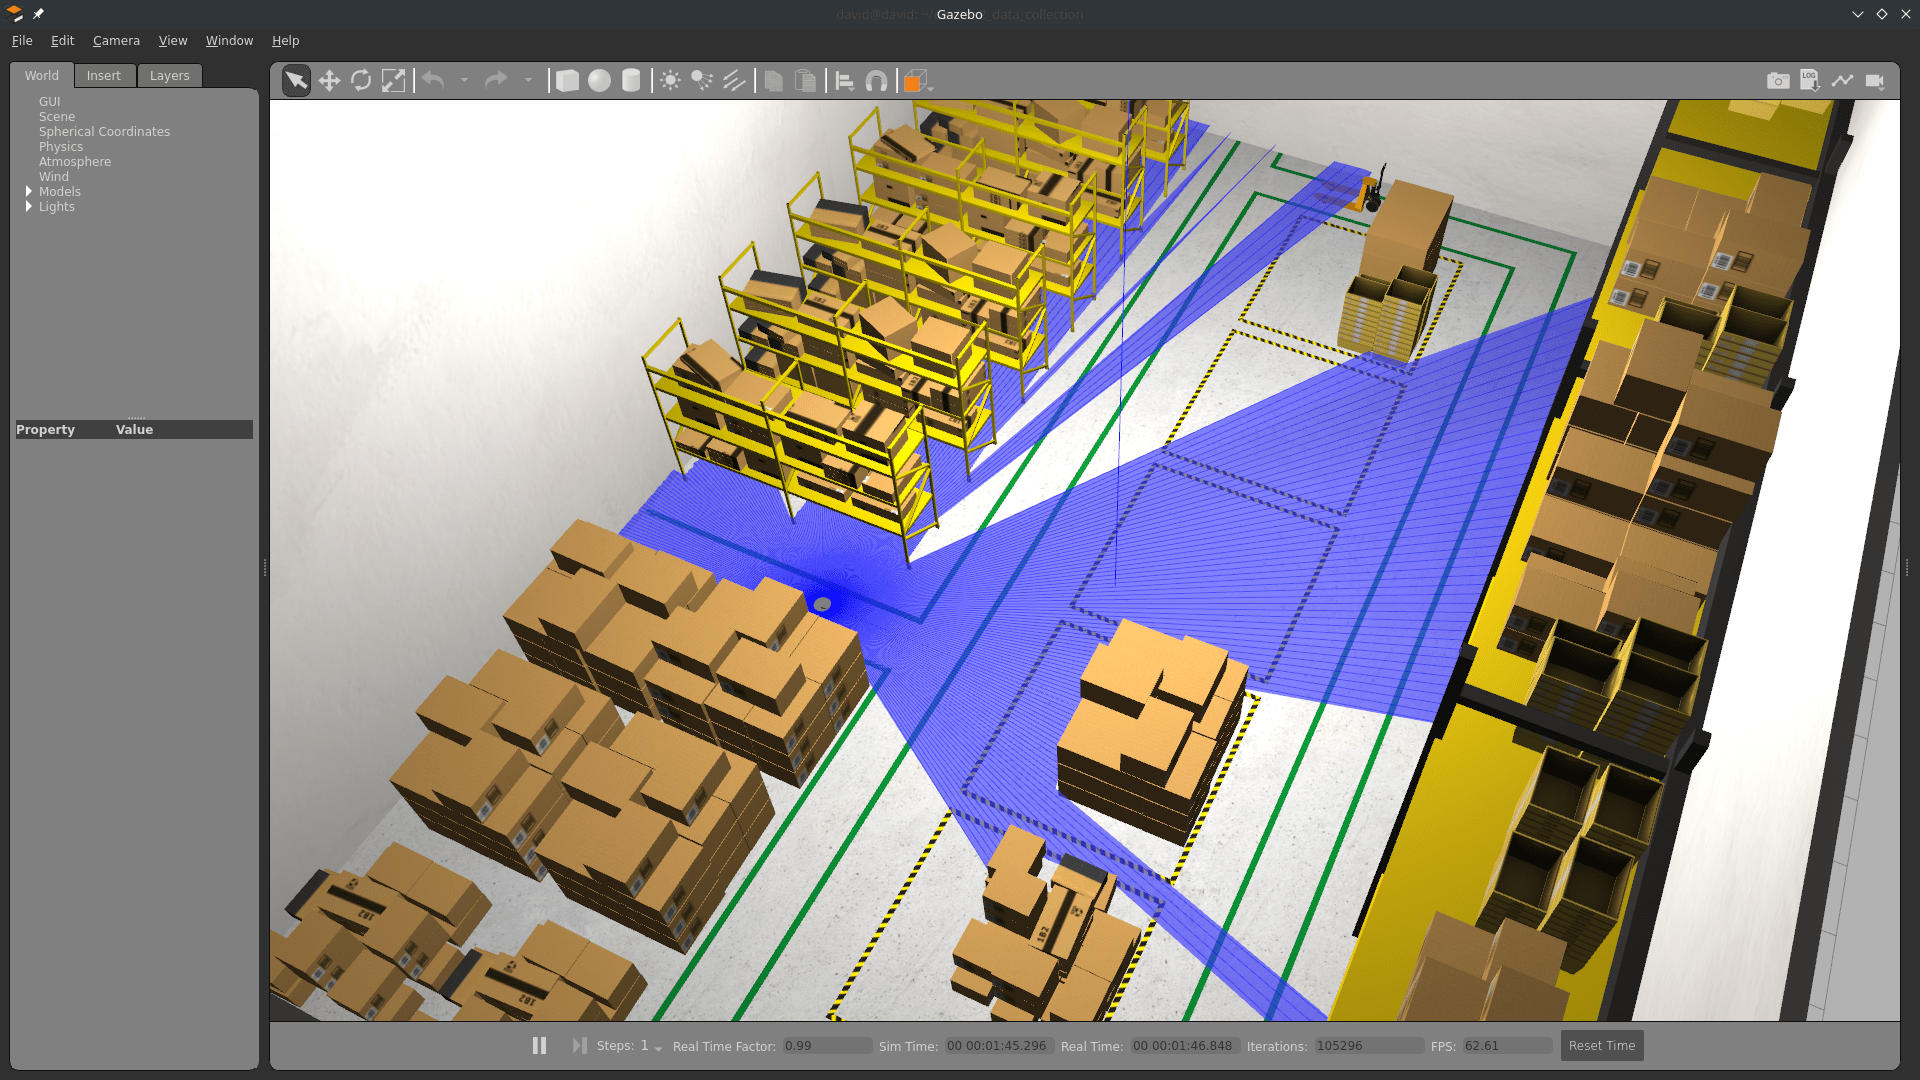
RViz and gz-sim will start: now you see the robot in the warehouse, and the map on RViz. AMCL sets the initial pose itself, so there is no need to click "2D Pose Estimate".
The warehouse world is heavy — 317 model instances. Expect a slow start and a real-time
factor well under 1 without a GPU; see dc_simulation/README.md for measured numbers.
Terminal 2: Start DC
Run colcon build to compile the workspace:
colcon build
Now, start the demo:
ros2 launch dc_demos tb3_simulation_pgsql_minio.launch.py use_sim_time:=True
use_sim_time defaults to False — without the override above, DC's Position
measurement looks up TF transforms on the wall clock while the simulation publishes
them on Gazebo's sim clock, which throws "extrapolation into the past"/"transform does
not exist" errors and can crash measurement_server outright (std::overflow_error in
tf2::Duration) once the two clocks drift far enough apart.
The robot will start collecting data.
Terminal 3: Start autonomous navigation
Execute
ros2 run nav2_simple_commander demo_security
The robot will start moving and you will be able to see all visualizations activated in RViz:
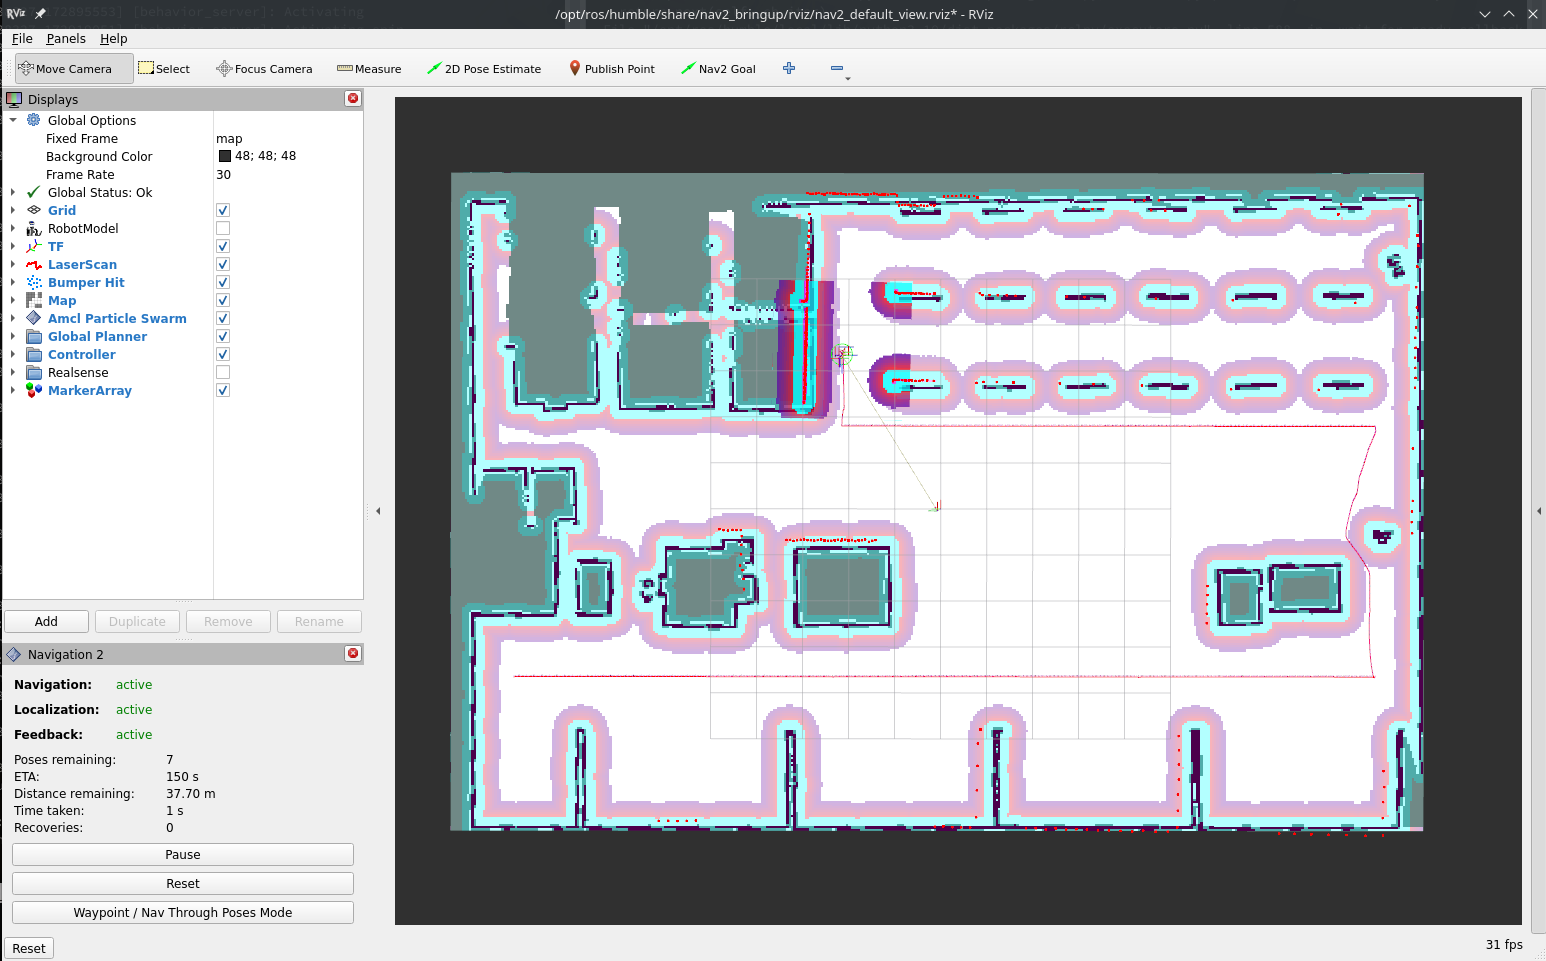
Visualize the data
In the database
Navigate to localhost:8080
- Select dc database
- Select dc table
- Click on Select data
You will see rows filling the database. You can click on one to see its content:
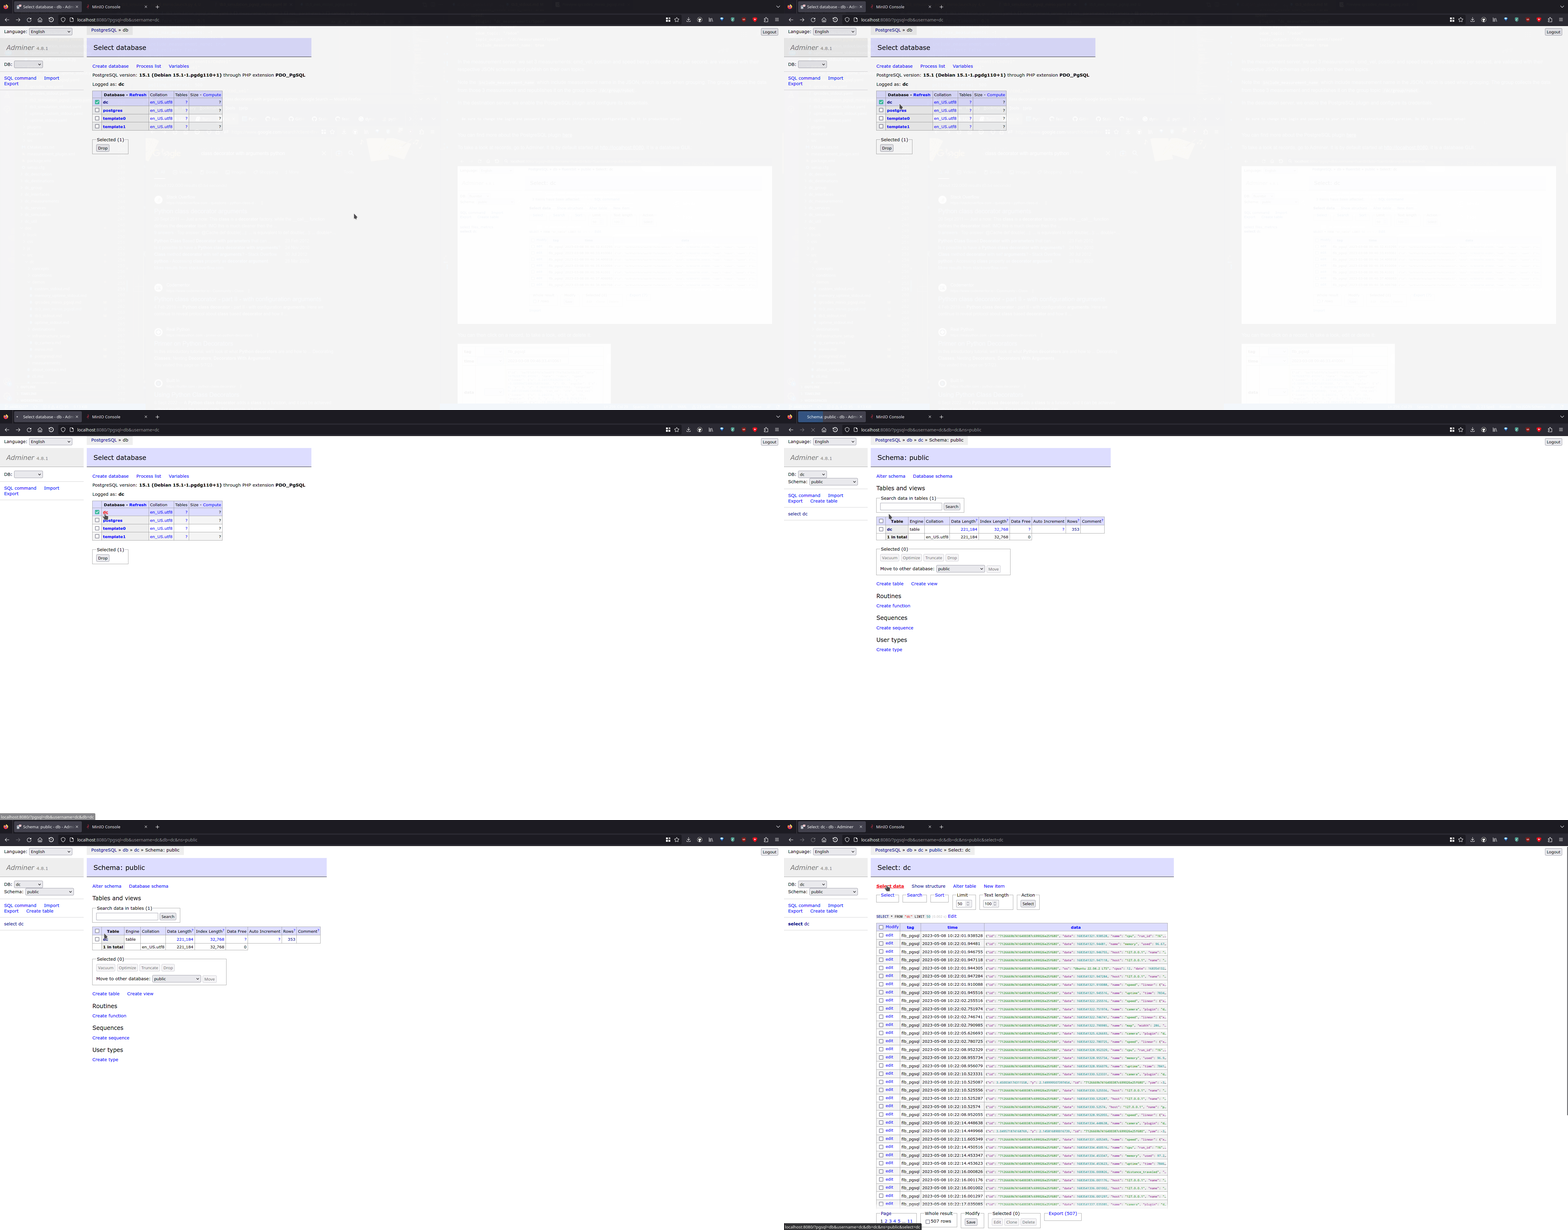
With Grafana
Four Grafana dashboards ship with the DC 2.0 infrastructure now — Home, Robot, KPI and Fast DDS statistics (the System/Environment/Infrastructure dashboards were dropped as out of scope for this minimal rework). Open http://localhost:3000 (admin/admin) and pick the Robot dashboard: its panels are backed by SQL queries against the dc/dc_files PostgreSQL tables — the Grafana datasource is PostgreSQL (uid dc_postgres) now, not InfluxDB. It shows, among other things, speed/command velocity over time and a table of uploaded inspection files with their RustFS + PostgreSQL upload status:
SELECT to_timestamp(updated_at) AS "time", group_name, robot_name, storage_type, remote_path, content_type, size, uploaded
FROM dc_files WHERE kind = 'file_status' ORDER BY updated_at DESC LIMIT 100
See tools/infrastructure/docker/config/grafana/dashboards/robot.json for every panel's exact query.
The KPI dashboard is the operations view of the same data: availability and uptime per robot over whatever time range the dashboard is set to, computed by the KPI views rather than by any panel query of its own. It populates from this demo's uptime Measurement with no extra configuration.
That's it! Now you can collect your data!
Understanding the configuration
The full configuration file can be found here.
Measurement server
Measurements
measurement_plugins sets which plugin to load. We collect
System measurements:
Robot measurements:
Environment measurements:
Infrastructure measurements:
Each has their own configuration: polling interval, source topic, destination paths, topics used as input etc. Going through each of them would be too long here but you can check for each measurement its documentation and the general documentation of measurements
The old MinIO setup needed two separate TCP health checks — minio_api_health (port 9000) and minio_dashboard_health (port 9001) — because it ran a 4-node MinIO cluster fronted by an nginx console. This demo's single RustFS container exposes only its API port, so it collapses to one rustfs_health check on port 9000; there is no separate console port to probe here.
measurement_server:
  ros__parameters:
    ...
    camera:
      plugin: "dc_measurements/Camera"
      cam_topic: "/intel_realsense_r200_depth/image_raw"
      cam_name: "Intel Realsense"
      save_raw_img: true
      save_raw_path: "camera/raw/%Y-%m-%dT%H-%M-%S"
      remote_prefixes: [""]
      remote_keys: ["rustfs"]
      ...
    map:
      plugin: "dc_measurements/Map"
      save_path: "map/%Y-%m-%dT%H-%M-%S"
      topic_output: "/dc/measurement/map"
      remote_prefixes: [""]
      remote_keys: ["rustfs"]
      ...
    rustfs_health:
      plugin: "dc_measurements/TCPHealth"
      topic_output: "/dc/measurement/rustfs_health"
      polling_interval: 5000
      host: "127.0.0.1"
      port: 9000
      name: "RustFS"
      include_measurement_plugin: true
    pgsql_health:
      plugin: "dc_measurements/TCPHealth"
      topic_output: "/dc/measurement/pgsql_health"
      polling_interval: 5000
      host: "127.0.0.1"
      port: 5432
      name: "PostgreSQL"
      include_measurement_plugin: true
Conditions
We also initialize conditions:
- min_distance_traveled
- max_distance_traveled
They are used in the distance traveled measurement to only take values in a certain range.
Destination server
Here we enable the records_log and rustfs Destinations, plus a passthrough for PostgreSQL:
dc_bridge:
  ros__parameters:
    shipper:
      data_dir: "$HOME/.dc/buffer"
    destinations: ["records_log", "rustfs"]
    records_log:
      type: file
      receives: records
      inputs: [
          # System
          "/dc/measurement/cpu",
          "/dc/measurement/memory",
          "/dc/measurement/os",
          "/dc/measurement/uptime",
          # Robot
          "/dc/measurement/camera",
          "/dc/measurement/cmd_vel",
          "/dc/measurement/distance_traveled",
          "/dc/measurement/driving_type",
          "/dc/measurement/position",
          "/dc/measurement/speed",
          # Environment
          "/dc/measurement/map",
          # Infrastructure
          "/dc/measurement/rustfs_health",
          "/dc/measurement/pgsql_health",
        ]
      path: "/tmp/dc/tb3_simulation_pgsql_minio_records.ndjson"
      time_key: "date"
    rustfs:
      type: s3
      receives: files
      inputs: ["/dc/measurement/map", "/dc/measurement/camera"]
      bucket: "dc-files"
      endpoint: "http://127.0.0.1:9000"
      region: "us-east-1"
      access_key_id: "rustfsadmin"
      secret_access_key: "rustfsadmin"
      force_path_style: true
    files:
      delete_when_sent: true
      metadata_destination: "records_log"
    custom_config_files: ["$HOME/.dc/tb3_simulation_pgsql_minio_sink.toml"]
# ~/.dc/tb3_simulation_pgsql_minio_sink.toml
[sinks.pgsql]
type = "postgres"
inputs = [
  "dc.dc.measurement.cpu", "dc.dc.measurement.memory", "dc.dc.measurement.os",
  "dc.dc.measurement.uptime", "dc.dc.measurement.camera", "dc.dc.measurement.cmd_vel",
  "dc.dc.measurement.distance_traveled", "dc.dc.measurement.driving_type",
  "dc.dc.measurement.position", "dc.dc.measurement.speed", "dc.dc.measurement.map",
  "dc.dc.measurement.rustfs_health", "dc.dc.measurement.pgsql_health",
]
endpoint = "postgres://dc:password@127.0.0.1:5432/dc"
table = "dc"

[sinks.pgsql.buffer]
type = "disk"
max_size = 268435488

[sinks.pgsql_files]
type = "postgres"
inputs = ["dc.dc.files"]
endpoint = "postgres://dc:password@127.0.0.1:5432/dc"
table = "dc_files"

[sinks.pgsql_files.buffer]
type = "disk"
max_size = 268435488
Copy the snippet into place before launching:
mkdir -p ~/.dc && cp "$(ros2 pkg prefix dc_demos)/share/dc_demos/config/tb3_simulation_pgsql_minio_sink.toml" ~/.dc/
PostgreSQL Destinations
PostgreSQL is reached through the ADR-0003
passthrough now, not a blessed postgres Destination — see
Destinations: Recipes. The
passthrough pgsql sink carries almost every measurement and the two infrastructure health
checks as plain Records. Note that not all data needs to go to PostgreSQL — only topics whose
dc.<tag> route exists (i.e. listed in records_log's inputs) reach it.
pgsql_files is a second, dedicated postgres sink in the same passthrough snippet for
dc_uploader's status Records — it has no ROS topic inputs of its own; it consumes the
dc.dc.files route instead, which records_log gains from being named as
files.metadata_destination (that parameter must name a configured receives: records
Destination, so it can't point at a passthrough-only sink id directly). See
Destinations, ADR-0005
and ADR-0014 for the full split, and the
QR codes demo for a worked example of the same pattern.
RustFS Destination
We list only map and camera in rustfs's inputs since those are the only measurements referencing Files. rustfs's type: s3 and receives: files mark it as owned by dc_uploader — a separate process from dc_bridge (ADR-0014) — rather than a Vector sink target: it uploads whatever File the measurement's remote_keys: ["rustfs"] pointed at it, verifies the object landed, and (with files.delete_when_sent: true) deletes the local copy only once that's confirmed. Unlike PostgreSQL, rustfs stays a blessed Destination: receives: files is served entirely by dc_uploader reading these same ROS params, never by a Vector sink, so there is no passthrough equivalent for it to migrate to.
Turtlebot3 AWS Warehouse InfluxDB
dc_bridge blesses exactly five Destination types — postgres, s3, file, console,
vector (see Destinations) — and InfluxDB is not one of them. This demo is
not a peer of the PostgreSQL/RustFS demos: it exists to show
how to reach a destination dc_bridge doesn't bless directly, via the
ADR-0003 passthrough escape
hatch — a raw Vector sink config loaded
through custom_config_files, consuming the same public dc.<tag> routes a blessed
Destination would. Read Destinations's "Passthrough" section first
if you haven't already; this page only covers what's specific to InfluxDB.
You will also need 3 terminal windows, to:
- Run the Nav2 turtlebot3 launchfile: it starts localization, navigation and RViz
- Run navigation inspection demo
- Run DC
Using a different terminal window for DC helps reading its information.
Setup the environment
Python dependencies
For this tutorial, we will need to install all dependencies, the demo dashboard's included (uv owns them; see Setup):
uv sync
Setup the infrastructure
InfluxDB
InfluxDB will be used to store our data and timestamps. To start it, follow the steps (tools/infrastructure/docker/docker-compose.influxdb.yaml, unchanged by the DC 2.0 rework — this demo still needs a real InfluxDB instance to point the passthrough sink at).
One-time: install the passthrough sink config
dc_bridge has no InfluxDB Destination to configure through ROS parameters, so the
Vector sink itself ships as a plain file in this package,
dc_demos/config/tb3_simulation_influxdb_sink.toml, installed to the package's share
directory. Copy it into place once before the first launch:
mkdir -p ~/.dc
cp "$(ros2 pkg prefix dc_demos)/share/dc_demos/config/tb3_simulation_influxdb_sink.toml" ~/.dc/
dc_params_file's custom_config_files (see below) points at this path.
Setup simulation environment
In the terminal 1, source your environment:
source /opt/ros/rolling/setup.bash
source install/setup.bash
Nothing else has to be exported. dc_simulation puts its own models and worlds on
GZ_SIM_RESOURCE_PATH through its environment hook.
This demo used to run aws_robomaker_small_warehouse_world under Gazebo Classic. That
package has no Jazzy release — its own jazzy branch still hard-depends on gazebo_ros,
which was never published for Jazzy. The warehouse now comes from dc_simulation
instead, which vendors the same AWS RoboMaker props (shelves, clutter, trash cans) into
a gz-sim world of its own.
Terminal 1: Start Navigation
Then, in the same terminal (1), start the simulation and Nav2. DC comes up separately in terminal 2, so turn it off here:
ros2 launch dc_demos tb3_qrcodes.launch.py \
    headless:=False \
    use_dc:=False
RViz and gz-sim will start: now you see the robot in the warehouse, and the map on RViz. AMCL sets the initial pose itself, so there is no need to click "2D Pose Estimate".
The warehouse world is heavy — 317 model instances. Expect a slow start and a real-time
factor well under 1 without a GPU; see dc_simulation/README.md for measured numbers.
Terminal 2: Start DC
Run colcon build to compile the workspace:
colcon build
Now, start the demo:
ros2 launch dc_demos tb3_simulation_influxdb.launch.py use_sim_time:=True
use_sim_time defaults to False — without the override above, DC's Position
measurement looks up TF transforms on the wall clock while the simulation publishes
them on Gazebo's sim clock, which throws "extrapolation into the past"/"transform does
not exist" errors and can crash measurement_server outright once the two clocks
drift far enough apart.
The robot will start collecting data.
InfluxDB 1.x's line protocol locks a field's type from its first write for the life
of the database. cpu.average is 0 (a bare JSON integer, not 0.0) on its very
first sample — before the plugin has two polls to compute a delta from — so Vector's
influxdb_logs sink writes it as an integer; every later float sample then fails with
field type conflict: ... is type float, already exists as type integer and is
silently dropped, forever, for that field in that database. Verified: after a full
demo run, SELECT count("/cpu/average") FROM dc returns nothing at all. This isn't
DC-specific — it's InfluxDB 1.x line protocol meeting JSON's 0/0.0 ambiguity — and
the only fix is dropping and recreating the dc database (influx -execute "DROP DATABASE dc; CREATE DATABASE dc") before a run where you need that field.
Terminal 3: Start autonomous navigation
Execute
ros2 run nav2_simple_commander demo_security
The robot will start moving and you will be able to see all visualizations activated in RViz:
Visualize the data
Grafana's own datasource is PostgreSQL now (see PostgreSQL/RustFS demo), and every dashboard shipped with the DC 2.0 infrastructure — Home, Robot, KPI and Fast DDS statistics — is backed by it: there is no Grafana dashboard for this demo's data, since it never touches PostgreSQL. To look at what landed in InfluxDB, use InfluxDB's own tooling instead:
influx -database dc -execute "SELECT * FROM dc ORDER BY time DESC LIMIT 20"
or query its HTTP API directly:
curl -G 'http://127.0.0.1:8086/query' --data-urlencode "db=dc" --data-urlencode "q=SELECT * FROM dc ORDER BY time DESC LIMIT 20"
Understanding the configuration
Measurement server
Measurements
measurement_plugins sets which plugin to load. We collect
System measurements:
Robot measurements:
Environment measurements:
Infrastructure measurements:
- InfluxDB health, a
TCPHealthcheck against InfluxDB's own port (8086) — unrelated to the passthrough mechanism, this is the same kind of infrastructure health-check measurement the PostgreSQL/RustFS demo uses for its own destinations.
None of this changed from the destination-agnostic measurement configuration used elsewhere in DC 2.0 — nested/flatten still shape the JSON for InfluxDB's line-protocol-oriented storage, and images (map, camera) are still stored as base64 strings since that's the only field type Grafana (or any consumer reading straight out of InfluxDB) can render from a database column. What changed is only how the Records reach InfluxDB in the first place — see the Destination section below.
measurement_server:
  ros__parameters:
    ...
    camera:
      plugin: "dc_measurements/Camera"
      topic_output: "/dc/measurement/camera"
      save_raw_base64: true
      nested: true
      flatten: true
      ...
    influxdb_health:
      plugin: "dc_measurements/TCPHealth"
      topic_output: "/dc/measurement/influxdb_health"
      polling_interval: 5000
      host: "127.0.0.1"
      port: 8086
      name: "InfluxDB"
      include_measurement_plugin: true
      nested: true
      flatten: true
An example camera Record, now without a tags field (that mechanism no longer exists — a Destination's inputs list decides routing instead). nested: true + flatten: true together produce /-prefixed dotted-path keys such as /camera/camera_name, which is also exactly what lands as the InfluxDB column name, since nothing downstream renames them:
{
  "/camera/base64/raw": "/9j/4AAQSkZJRgABAQAA...",
  "/camera/camera_name": "Intel Realsense",
  "custom_keys": ["robot_name", "id"],
  "date": 1677668926.700422,
  "flattened": true,
  "host": "127.0.0.1",
  "id": "be781e5ffb1e7ee4f817fe7b63e92c32",
  "name": "camera",
  "nested": true,
  "robot_name": "Turtlebot",
  "run_id": "218",
  "source_type": "fluent",
  "tag": "dc.measurement.camera",
  "timestamp": "2026-09-04T00:00:40.252Z"
}
Conditions
We also initialize conditions:
- min_distance_traveled
- max_distance_traveled
They are used in the distance traveled measurement to only take values in a certain range.
Destination: the passthrough
There is no InfluxDB Destination to bless, but destinations is not empty — it names a
file Destination whose inputs are what put these topics on the dc.<tag> routes the
snippet consumes:
dc_bridge:
  ros__parameters:
    shipper:
      data_dir: "$HOME/.dc/buffer"
    destinations: ["records_log"]
    records_log:
      type: file
      receives: records
      inputs: ["/dc/measurement/cpu", "/dc/measurement/memory", ...]
      path: "/tmp/dc/tb3_simulation_influxdb_records.ndjson"
      time_key: "date"
      time_format: "double"
    custom_config_files: ["$HOME/.dc/tb3_simulation_influxdb_sink.toml"]
    vector_forward_host: "127.0.0.1"
    vector_forward_port: 24224
dc_bridge derives both its ROS subscriptions and its dc.<tag> route branches from
destinations, and never reads a passthrough snippet's inputs — so a passthrough always
accompanies at least one blessed Destination covering the same topics. file is the
anchor in every passthrough demo in this repo now, including this one — blessed console
moved to a passthrough recipe of its own (ADR-0003,
Destinations: Recipes) —
but it would have been the wrong anchor for this demo regardless, even back when it was
still blessed: this demo collects base64 camera and map images, which make for unreadable
terminal output. The Elasticsearch tutorial explains the file
anchor mechanics in more detail.
destinations: [] does not work as a way to say "passthrough only". rclcpp cannot load an
empty YAML sequence (no inferable element type), so the Bridge dies at startup with
parameter_value_from failed for parameter 'destinations': No parameter value set and
never reads custom_config_files at all.
custom_config_files lists raw Vector config snippets that are merged as-is alongside whatever dc_bridge itself renders (here, nothing) — see Destinations's passthrough section for the full contract (naming collisions, vector validate as a startup backstop, etc.). The snippet installed above:
# ~/.dc/tb3_simulation_influxdb_sink.toml
[sinks.influxdb]
type = "influxdb_logs"
inputs = [
  "dc.dc.measurement.cpu",
  "dc.dc.measurement.memory",
  "dc.dc.measurement.os",
  "dc.dc.measurement.uptime",
  "dc.dc.measurement.camera",
  "dc.dc.measurement.cmd_vel",
  "dc.dc.measurement.distance_traveled",
  "dc.dc.measurement.position",
  "dc.dc.measurement.speed",
  "dc.dc.measurement.map",
  "dc.dc.measurement.influxdb_health",
]
endpoint = "http://127.0.0.1:8086"
measurement = "dc"

[sinks.influxdb.influxdb1_settings]
database = "dc"
username = "dc"
Each inputs entry is one of the stable dc.<tag> routes dc_bridge exposes for every topic that appears in any Destination's inputs or, as here, any custom_config_files snippet's inputs — the Tag is the topic name with the leading / dropped and the rest of the /s turned into . (/dc/measurement/cpu → dc.measurement.cpu), and the route is dc.<tag> (so dc.dc.measurement.cpu). Vector's influxdb_logs sink type is what actually understands InfluxDB 1.x's write API; nothing in this snippet is DC-specific beyond the dc.<tag> inputs.
Set real InfluxDB credentials (or an auth token, depending on your InfluxDB version) in the snippet before pointing this at anything but the demo's own local, unauthenticated-by-default instance.
Advanced
Either you run the whole inspection pipeline at once — Measurements, Conditions, Groups, File uploads and the Grafana dashboards reading them back — or you leave YAML behind and write DC code yourself.
Prerequisites: the Intermediate tier, plus several services running together for the QR codes pipeline, and a C++ toolchain for the custom plugin. Roughly 45 minutes for the QR codes pipeline, 30 for the custom plugin including the rebuild.
| Title | Description | Also needs |
|---|---|---|
| Turtlebot3 QR codes | Collect QR codes and images, upload them as Files and read them back in Grafana | PostgreSQL, RustFS and Grafana running together, plus the simulator |
| Fast DDS statistics | Collect Fast DDS's own network statistics and read them back in Grafana. No robot or simulator needed | PostgreSQL and Grafana running together, plus Fast DDS built with its Statistics Module enabled |
| Custom plugin | Create an external plugin | No service — a colcon build of your own plugin package |
Note that each demo assumes concepts explained in previous demos will be acknowledged.
QRCodes
In this example, we add a robot and start collecting robot data to PostgreSQL, and maps and scanned QR codes to RustFS as image files.
You will also need 3 terminal windows, to:
- Run the simulation + Nav2 launchfile: it starts gz-sim, localization, navigation and RViz
- Run DC
- Drive the robot past the QR codes
Keeping them separate helps reading the JSON printed on the DC terminal, which RViz and gz-sim would otherwise drown out.
| Terminal | Description |
|---|---|
| Nav2 | gz-sim, localization, navigation and RViz |
| DC | Data collection |
| Run | Waypoint follower driving past every QR-coded pallet |
Setup RustFS and PostgreSQL
RustFS
RustFS will be used as storage for the map and camera image Files. To start it, follow the steps — a single RustFS container plus a one-shot container that bootstraps the dc-files bucket the Destinations below upload into, using the default rustfsadmin/rustfsadmin credentials this demo's params file already assumes.
PostgreSQL
PostgreSQL will be used as database storage for our JSON. Later on, backend engineers can make requests on those JSON based on measurement requested and time range. To start it, follow the steps
Vector's postgres sink maps each top-level key of a Record's JSON payload onto an existing column of the same name — it does not create tables or columns itself. tools/infrastructure/docker/config/postgresql/init.sql pre-creates the dc and dc_files tables this demo writes into; see its header comment for the full column reference if you add a measurement whose fields aren't already columns.
Setup the ROS environment
In each terminal, source your environment:
source /opt/ros/rolling/setup.bash
source install/setup.bash
Nothing else has to be exported. dc_simulation's environment hook puts its own
models/ and worlds/ on GZ_SIM_RESOURCE_PATH, and warehouse.launch.py adds
nav2_minimal_tb3_sim's models (where the TurtleBot3 meshes live now — the
Gazebo Classic turtlebot3_gazebo package has no Jazzy release).
Start Navigation
dc_demos' own launch file brings up gz-sim with the QR-code warehouse world,
spawns dc_simulation's TurtleBot3-Waffle with its ros_gz_bridge, and starts
Nav2 (map_server + AMCL + planners) against dc_simulation/maps/qrcodes.yaml.
It also starts DC, which this demo drives separately, so turn that off here:
ros2 launch dc_demos tb3_qrcodes.launch.py \
    headless:=False \
    use_dc:=False
gz-sim and RViz will start: you should see the robot in the warehouse, and the
map in RViz. AMCL sets the demo's initial pose itself (set_initial_pose in
qrcodes_nav.yaml), so there is no need to click "2D Pose Estimate" — wait until
the laser scan lines up with the map before starting the run below.
The warehouse world is heavy: 238 model instances, most of them the QR-coded pallets and the props stacked on them. Expect a slow start on a machine without a GPU: gz-sim, the robot and Nav2 come up in well under a minute, but with the real-time factor well under 1 (~0.11-0.2, see dc_simulation's README for the measured breakdown), reaching the first QR-coded pallet and getting the first Record out of the demo can take several minutes of wall clock, and the full 60-waypoint pass over an hour. See #52.
Start DC
Execute
ros2 launch dc_demos tb3_qrcodes_minio_pgsql.launch.py use_sim_time:=True
use_sim_time defaults to False — without the override above, DC's Position
measurement looks up TF transforms on the wall clock while the simulation publishes
them on Gazebo's sim clock, which throws "extrapolation into the past"/"transform does
not exist" errors and can crash measurement_server outright once the two clocks
drift far enough apart (same issue as the PostgreSQL/RustFS
and InfluxDB demos).
With this, all data will be transmitted
Drive the robot past the QR codes
In a fourth terminal, run the waypoint follower. It sends the robot down each aisle, stopping in front of every QR-coded pallet so both cameras can read them, and exits once the pass is complete:
ros2 run dc_demos qrcodes_waypoint_follower
The waypoints are camera stations, and the aisles are narrow enough that positioning accuracy matters: a code is only readable while
|lateral error| + standoff * tan(|yaw error|) + 0.181 <= standoff * tan(30°)
where 0.181 m is half a rendered QR symbol and 30° is half the cameras' field of view.
The tightest station has a 0.73 m standoff, which is why qrcodes_nav.yaml stops the
robot within 0.1 m and 0.1 rad rather than Nav2's more usual tolerances. If you move the
waypoints, the pallets or the cameras, re-run ./tools/sim/scripts/run.sh — its lint
stage re-derives that inequality from the world, the robot model, the waypoints and the
nav params, and its detect stage checks that codes really do come back. See
dc_simulation's README
for the measured geometry.
Understanding the configuration
The full configuration file can be found here.
For this demo, we will reconstruct the yaml configuration element by element, given how large it is. Go through the explanation to understand how it works.
Collect command velocity, position and speed to PostgreSQL as a group
Similarly to the previous tutorial:
dc_bridge:
  ros__parameters:
    shipper:
      data_dir: "$HOME/.dc/buffer"
    destinations: ["records_log", "rustfs"]
    records_log:
      type: file
      receives: records
      inputs:
        [
          "/dc/measurement/map",
          "/dc/measurement/right_camera",
          "/dc/measurement/left_camera",
          "/dc/group/robot",
        ]
      path: "/tmp/dc/qrcodes_minio_pgsql_records.ndjson"
      time_key: "date"
    custom_config_files: ["$HOME/.dc/qrcodes_minio_pgsql_sink.toml"]

group_server:
  ros__parameters:
    groups: ["robot"]
    robot:
      inputs:
        [
          "/dc/measurement/cmd_vel",
          "/dc/measurement/position",
          "/dc/measurement/speed",
        ]
      output: "/dc/group/robot"
      sync_delay: 5.0
      group_key: "robot"

measurement_server:
  ros__parameters:
    custom_keys_str: ["robot_name"]
    robot_name: "C3PO"
    measurement_plugins: ["cmd_vel", "position", "speed"]
    custom_key_str_list: ["robot_name", "id"]
    custom_keys_str:
      robot_name:
        name: robot_name
        value: "C3PO"
      # Requires systemd package
      id:
        name: id
        value_from_file: /etc/machine-id
    run_id:
      enabled: true
      counter: true
      counter_path: "$HOME/run_id"
      uuid: false
    moving:
      plugin: "dc_conditions/Moving"
    cmd_vel:
      plugin: "dc_measurements/CmdVel"
      group_key: "cmd_vel"
      enable_validator: true
      topic_output: "/dc/measurement/cmd_vel"
      include_measurement_name: true
    position:
      plugin: "dc_measurements/Position"
      group_key: "position"
      topic_output: "/dc/measurement/position"
      enable_validator: true
      global_frame: "map"
      robot_base_frame: "base_link"
      transform_timeout: 0.1
      include_measurement_name: true
    speed:
      plugin: "dc_measurements/Speed"
      group_key: "speed"
      odom_topic: "/odom"
      topic_output: "/dc/measurement/speed"
      include_measurement_name: true
In the measurement server, we set 3 measurements: cmd_vel, position and speed being collected once per second, are validated with their respective JSON schemas and publish on their own topics.
Note the include_measurement_name which include measurement name in the JSON, which is used when grouping. The group collects the data from those 3 measurement and republishes it on the group topic /dc/group/robot.
dc_bridge owns every Destination this demo uses. records_log's inputs list already
names every topic this demo produces (/dc/group/robot for this section, plus
/dc/measurement/map, /dc/measurement/right_camera and /dc/measurement/left_camera for
the sections below): unlike the retired per-measurement tags: [...] mechanism, a
Destination's inputs is the single place that decides what reaches it, so we declare it
once and simply grow the measurements that feed those topics as we go.
records_log is a file Destination, not postgres — PostgreSQL is reached through the
ADR-0003 passthrough instead. The
actual postgres sink lives in qrcodes_minio_pgsql_sink.toml, a raw Vector config
snippet loaded via custom_config_files:
# ~/.dc/qrcodes_minio_pgsql_sink.toml
[sinks.pgsql]
type = "postgres"
inputs = [
  "dc.dc.measurement.map",
  "dc.dc.measurement.right_camera",
  "dc.dc.measurement.left_camera",
  "dc.dc.group.robot",
]
endpoint = "postgres://dc:password@127.0.0.1:5432/dc"
table = "dc"

[sinks.pgsql.buffer]
type = "disk"
max_size = 268435488
dc_bridge derives its ROS subscriptions and dc.<tag> routes from destinations alone,
never from a passthrough snippet's inputs — that's why records_log still lists every
topic even though the snippet above is what actually reaches PostgreSQL. Copy the snippet
into place before launching:
mkdir -p ~/.dc && cp "$(ros2 pkg prefix dc_demos)/share/dc_demos/config/qrcodes_minio_pgsql_sink.toml" ~/.dc/
Be sure to change the login and password to your current infrastructure configuration. Do it in production setup!
You can find more about the postgres sink recipe here
To take a look at records, go to Adminer. It is by default started at http://localhost:8080, it is a database GUI.:
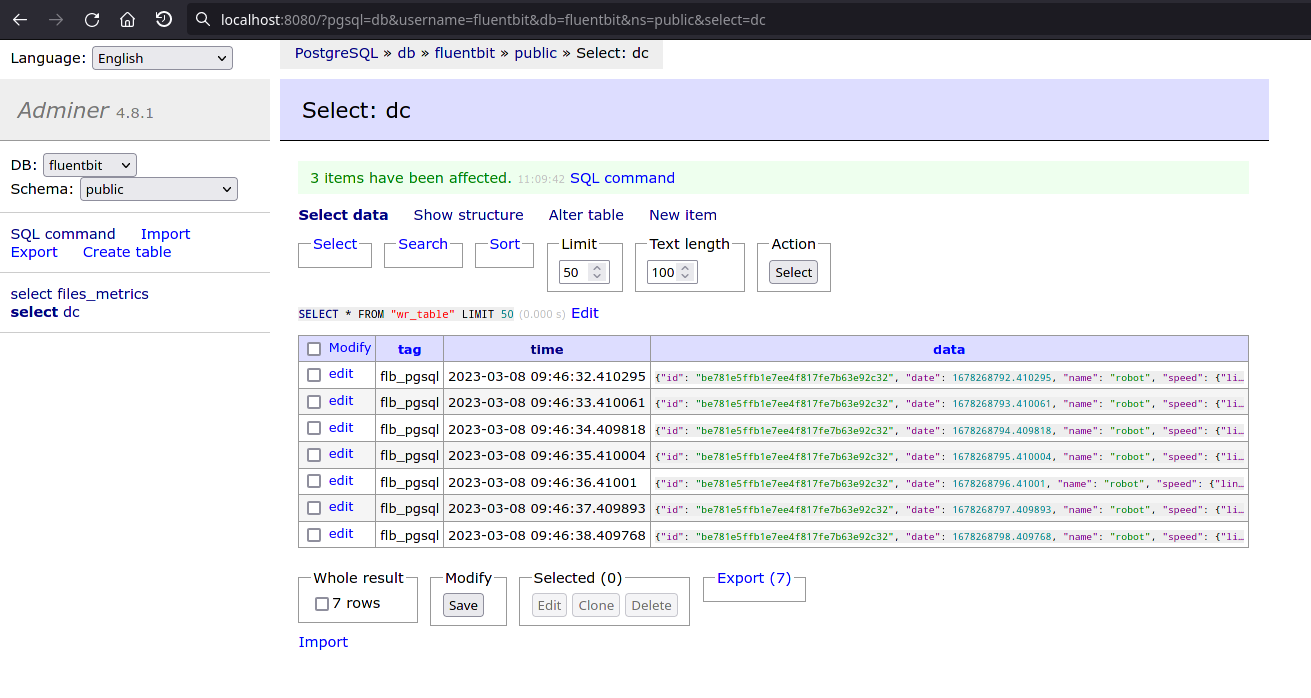
You can then click on a record, to take a look, edit or delete it:
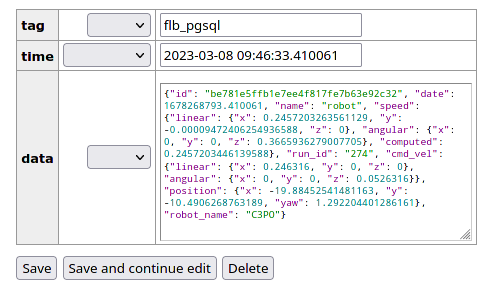
Send the map image and YAML from nav2_map_server to RustFS
First, we add the map measurement. Its remote_keys names the rustfs Destination, which is what actually uploads the pgm/yaml Files — the map measurement only records where they are, locally and (once uploaded) remotely:
measurement_server:
  ros__parameters:
  ...
  measurement_plugins: ["map"]
  map:
    plugin: "dc_measurements/Map"
    group_key: "map"
    polling_interval: 5000
    save_path: "map/%Y-%m-%dT%H:%M:%S"
    topic_output: "/dc/measurement/map"
    save_map_timeout: 4.0
    remote_prefixes: [""]
    remote_keys: ["rustfs"]
    enable_validator: true
    include_measurement_name: true
  ...
Then, the Destinations that make this work:
dc_bridge:
  ros__parameters:
    ...
    destinations: ["records_log", "rustfs"]
    rustfs:
      type: s3
      receives: files
      inputs:
        [
          "/dc/measurement/map",
          "/dc/measurement/right_camera",
          "/dc/measurement/left_camera",
        ]
      bucket: "dc-files"
      endpoint: "http://127.0.0.1:9000"
      region: "us-east-1"
      access_key_id: "rustfsadmin"
      secret_access_key: "rustfsadmin"
      force_path_style: true
    files:
      delete_when_sent: true
      metadata_destination: "records_log"
# ~/.dc/qrcodes_minio_pgsql_sink.toml (continued)
[sinks.pgsql_files]
type = "postgres"
inputs = ["dc.dc.files"]
endpoint = "postgres://dc:password@127.0.0.1:5432/dc"
table = "dc_files"

[sinks.pgsql_files.buffer]
type = "disk"
max_size = 268435488
This introduces the two-way PostgreSQL split this demo relies on:
pgsql(the passthrough sink declared above) carries the map's own metadata Record (dimensions, resolution, local/remote paths) like any other measurement.pgsql_filesis a secondpostgressink in the same passthrough snippet, dedicated to the Uploader's own bookkeeping. It has no ROS topicinputsof its own — it consumes thedc.dc.filesroute instead, whichrecords_loggains from being named asfiles.metadata_destinationbelow.files.metadata_destinationmust name a configuredreceives: recordsDestination (dc_bridgerejects anything else at startup), which is why it namesrecords_lograther than the passthrough sink directly — a passthrough-only sink id isn't eligible.rustfsis thes3Destination that actually uploads the pgm/yaml bytes.receives: filesmarks it as owned bydc_uploader— a separate process fromdc_bridge(ADR-0014) — rather than a Vector sink:dc_bridgesubscribes torustfs'sinputs, and durably enqueues an intent for any Record withremote_pathsentries whose key matches a Destination name — hererustfs, matching the map measurement'sremote_keysabove.dc_uploaderreads that intent, uploads the referenced Files, verifies they landed, and emits a status Record underdc.files, routed torecords_log(and, from there, consumed by thepgsql_filespassthrough sink). Unlikepgsql/pgsql_files,rustfsstays blessed:receives: filesis served entirely bydc_uploaderreading these same ROS params, never by a Vector sink, so there is no passthrough equivalent for it to migrate to.
See Destinations for the full files:/Uploader contract, and ADR-0005 / ADR-0014 for why file uploads are a DC responsibility rather than a Vector sink, and why that logic now runs as its own process.
files.delete_when_sent: true means the local pgm/yaml are removed only once RustFS confirms the upload — never before.
You can check upload status and completion in Grafana's Robot dashboard, whose "Uploaded inspection files" and "Group completion status" panels query the dc_files table pgsql_files writes into:
SELECT to_timestamp(updated_at) AS "time", group_name, robot_name, storage_type, remote_path, content_type, size, uploaded
FROM dc_files WHERE kind = 'file_status' ORDER BY updated_at DESC LIMIT 100
Then, similarly, on Adminer, you can browse the dc table's map rows.
Send QR code images to RustFS
We want to collect pictures taken by the cameras
measurement_server:
  ros__parameters:
  ...
  measurement_plugins: ["cmd_vel", "position", "speed", "map", "right_camera", "left_camera"]
  condition_plugins: ["moving", "inspected_exists"]
  custom_key_str_list: ["robot_name", "id"]
  custom_keys_str:
    robot_name:
      name: robot_name
      value: "C3PO"
    # Requires systemd package
    id:
      name: id
      value_from_file: /etc/machine-id
  run_id:
    enabled: true
    counter: true
    counter_path: "$HOME/run_id"
    uuid: false
  moving:
    plugin: "dc_conditions/Moving"
  inspected_exists:
    plugin: "dc_conditions/Compare"
    key: "inspected"
    comparison: "exists"
  right_camera:
    plugin: "dc_measurements/Camera"
    group_key: "right_camera"
    if_none_conditions: ["moving"]
    if_all_conditions: ["inspected_exists"]
    topic_output: "/dc/measurement/right_camera"
    init_collect: false
    init_max_measurements: -1
    condition_max_measurements: 1
    node_name: "dc_measurement_camera"
    cam_topic: "/right_intel_realsense_r200_depth/image_raw"
    cam_name: right_camera
    enable_validator: true
    draw_det_barcodes: true
    save_raw_img: false
    save_rotated_img: false
    save_detections_img: true
    save_inspected_path: "right_camera/inspected/%Y-%m-%dT%H-%M-%S"
    rotation_angle: 0
    detection_modules: ["barcode"]
    remote_prefixes: [""]
    remote_keys: ["rustfs"]
    include_measurement_name: true
  left_camera:
    plugin: "dc_measurements/Camera"
    group_key: "left_camera"
    if_none_conditions: ["moving"]
    if_all_conditions: ["inspected_exists"]
    topic_output: "/dc/measurement/left_camera"
    init_collect: true
    init_max_measurements: -1
    condition_max_measurements: 1
    node_name: "dc_measurement_camera"
    cam_topic: "/left_intel_realsense_r200_depth/image_raw"
    cam_name: left_camera
    enable_validator: true
    draw_det_barcodes: true
    save_raw_img: false
    save_rotated_img: false
    save_detections_img: true
    save_inspected_path: "left_camera/inspected/%Y-%m-%dT%H-%M-%S"
    rotation_angle: 0
    detection_modules: ["barcode"]
    remote_prefixes: [""]
    remote_keys: ["rustfs"]
    include_measurement_name: true
  ...
Taking a look at the cameras, we can understand that:
- Data is only collected when the robot is not moving:
if_none_conditions: ["moving"] - Data is only collected when there is inspected data, so only when a QR code is detected:
if_all_conditions: ["inspected_exists"] - Data is not collected constantly:
init_max_measurements: -1 - Only one record is collected when conditions are triggered:
condition_max_measurements: 1 - Only images with inspected data are collected:
save_raw_img: falsesave_rotated_img: falsesave_detections_img: true
- Barcodes are scanned in each image:
detection_modules: ["barcode"]
include_measurement_name matters here too: the Uploader relies on it to know which top-level field of the Record holds the local_paths/remote_paths it should act on.
No new Destination block is needed for the cameras: records_log and rustfs already list /dc/measurement/right_camera and /dc/measurement/left_camera in their inputs (see the first section above), and the passthrough pgsql sink already consumes the matching dc.<tag> routes those inputs create — a Destination's inputs is a single, global list of topics rather than something declared per measurement, so adding a measurement that feeds an already-configured Destination requires no dc_bridge change at all.
Here, we collect images with the rustfs Destination, and their metadata (which record they belong to, remote path once uploaded, image dimensions where relevant) through the passthrough pgsql sink. pgsql_files, fed by the Uploader, tracks when each image is sent to RustFS and — with files.delete_when_sent: true — is deleted locally once confirmed. Note that a Record's remote_paths can name several Destinations at once; the Uploader sends to every one whose name appears there.
An example Record for right_camera, once the image is inspected:
{
  "camera_name": "right_camera",
  "date": 1677668926.700422,
  "flattened": false,
  "id": "be781e5ffb1e7ee4f817fe7b63e92c32",
  "nested": false,
  "robot_name": "C3PO",
  "run_id": "218",
  "local_img_paths": {
    "inspected": "/root/dc_data/C3PO/2023/03/01/17/right_camera/inspected/2023-03-01T17-12-57.jpg"
  },
  "remote_paths": {
    "rustfs": {
      "inspected": "C3PO/2023/03/01/17/right_camera/inspected/2023-03-01T17-12-57.jpg"
    }
  },
  "inspected": {
    "barcode": [
      {
        "data": [81, 82, 99, 111, 100, 101, 45, 49],
        "height": 40,
        "width": 40,
        "top": 120,
        "left": 200,
        "type": "QRCODE"
      }
    ]
  }
}
Fast DDS statistics to PostgreSQL/Grafana
This demo only produces data when Fast DDS is the RMW in use and it was built with its
Statistics Module enabled (-DFASTDDS_STATISTICS=ON), plus fastdds_statistics_backend
installed against it — pin a v2.x tag, the line built against the Fast-DDS 3.x that
ROS 2 Rolling ships. A third, runtime-only prerequisite is easy to miss: the
FASTDDS_STATISTICS environment variable must be set on every process before it creates its
first DomainParticipant, or latency_ns_mean and every throughput/RTPS field stay permanently
absent even though the plugin itself runs fine. See the Fast DDS statistics Measurement
doc for the full build recipe and all three prerequisites.
Without the first two, dc_measurements still builds and every other demo still runs —
dc_measurements/CMakeLists.txt finds fastdds_statistics_backend optionally and skips only
this one plugin — but launching this demo fails: measurement_server can't load a
dc_measurements/FastddsStats plugin that was never built.
This is the smallest hardware-free way to see Fast DDS's own Statistics Module land in DC: one
Measurement (Fast DDS statistics), a passthrough postgres
sink (ADR-0003), and a Grafana dashboard
provisioned automatically — the same convention #304 established for the
KPI dashboard.
Setup Infrastructure
PostgreSQL
Follow the steps to start it. The default yaml configuration file does not need change.
Grafana
Follow the steps to start it.
Run the demo
colcon build
mkdir -p ~/.dc && cp "$(ros2 pkg prefix dc_demos)/share/dc_demos/config/fastdds_stats_pgsql_grafana_sink.toml" ~/.dc/
export FASTDDS_STATISTICS="HISTORY_LATENCY_TOPIC;PUBLICATION_THROUGHPUT_TOPIC;SUBSCRIPTION_THROUGHPUT_TOPIC;RTPS_SENT_TOPIC;RTPS_LOST_TOPIC"
ros2 launch dc_demos fastdds_stats_pgsql_grafana.launch.py
A Record captured from a real run, echoed straight off /dc/measurement/fastdds_stats
(no PostgreSQL needed to see this — it's what dc_bridge forwards on):
{
  "custom_keys": ["robot_name"],
  "datareader_count": 1,
  "datawriter_count": 11,
  "domain_id": 0,
  "event": "sample",
  "flattened": false,
  "hosts": ["d:14058711922191368192"],
  "name": "fastdds_stats",
  "nested": false,
  "participant_count": 3,
  "participants": [
    { "guid": "01.0f.4d.26.9c.1d.72.46.00.00.00.00|0.0.1.c1", "name": "/" },
    { "guid": "01.0f.4d.26.13.27.ae.cb.00.00.00.00|0.0.1.c1", "name": "/" },
    { "guid": "01.0f.4d.26.25.27.c4.fd.00.00.00.00|0.0.1.c1", "name": "/" }
  ],
  "process_names": ["7580", "10003", "10021"],
  "robot_name": "C3PO",
  "run_id": "172",
  "users": ["root"]
}
latency_ns_mean and the throughput/RTPS fields are absent in this particular sample:
nothing exchanged data on a matched DataWriter/DataReader pair within that 5-second poll
window. See the Measurement's own page for why
absence is what "nothing to report" looks like here.
Visualize the data
Open http://localhost:3000 (admin/admin) and pick the ROS 2 Data
Collection - Fast DDS statistics dashboard. Its panels are backed by SQL queries against the
dc PostgreSQL table (datasource uid dc_postgres), the same one every other PostgreSQL demo
writes to — filtered to WHERE name = 'fastdds_stats':
- Write-to-notification latency, mean across matched DataWriter/DataReader pairs
- Publication and subscription throughput, mean
- Discovered participant/DataWriter/DataReader counts over time
- RTPS packets sent and lost
- The most recent sample's physical-layer data — which hosts, users and processes are behind the discovered participants
See tools/infrastructure/docker/config/grafana/dashboards/fastdds_stats.json for every panel's
exact query.
Understanding the configuration
The full configuration file can be found here.
measurement_server:
  ros__parameters:
    measurement_plugins: ["fastdds_stats"]
    fastdds_stats:
      plugin: "dc_measurements/FastddsStats"
      topic_output: "/dc/measurement/fastdds_stats"
      polling_interval: 5000
      domain_id: 0
      include_measurement_name: true
      init_collect: true

dc_bridge:
  ros__parameters:
    destinations: ["records_log"]
    records_log:
      type: file
      receives: records
      inputs: ["/dc/measurement/fastdds_stats"]
      path: "/tmp/dc/fastdds_stats_pgsql_grafana_records.ndjson"
      time_key: "date"
      time_format: "double"
    custom_config_files: ["$HOME/.dc/fastdds_stats_pgsql_grafana_sink.toml"]
# ~/.dc/fastdds_stats_pgsql_grafana_sink.toml
[sinks.pgsql]
type = "postgres"
inputs = ["dc.dc.measurement.fastdds_stats"]
endpoint = "postgres://dc:password@127.0.0.1:5432/dc"
table = "dc"

[sinks.pgsql.buffer]
type = "disk"
max_size = 268435488
postgres — along with s3 and console — moved from the blessed ROS-param form to this
passthrough recipe (ADR-0003); records_log
is the cheap file anchor the passthrough still needs, since dc_bridge derives its ROS
subscriptions and dc.<tag> routes from destinations alone. See
Destinations: Recipes for the
full recipe. domain_id is the DDS domain to monitor — the same value ROS_DOMAIN_ID would use
for every other node in the deployment. include_measurement_name: true writes
"name": "fastdds_stats" onto every Record, which every panel's WHERE name = 'fastdds_stats'
clause relies on to tell this Measurement's rows apart from any other demo sharing the same dc
table.
Custom uptime to Stdout
In this demo, we will go through a new use case. You want to create your own measurement or use an existing measurement provided by dc_measurements but not exactly, you want to add a field and also modify the JSON schema. That is what we will do here: create a new plugin, inside dc_demos, another package, create a plugin and load it
We are going to take the uptime measurement, change it slightly and collect the data.
To test it, run:
ros2 launch dc_demos uptime_custom_stdout.launch.py
JSON schema
Located in dc_demos/plugins/measurements/json/uptime_custom.json:
{
  "$schema": "http://json-schema.org/draft-07/schema#",
  "title": "Uptime Custom",
  "description": "Time the system has been up. Intentionally failing to demonstrate customization and callback",
  "properties": {
    "time": {
      "description": "Time the system has been up",
      "type": "integer",
      "maximum": 0
    }
  },
  "type": "object"
}
It is almost the same as the standard uptime, but for the sake of the example, we will set the maximum value to 0, which will certainly make the validation fail!
CPP code
First, we create a hpp file in dc_demos/include/dc_demos/plugins/measurements:
#ifndef DC_DEMOS__PLUGINS__MEASUREMENTS__UPTIME_CUSTOM_HPP_
#define DC_DEMOS__PLUGINS__MEASUREMENTS__UPTIME_CUSTOM_HPP_

#include <nlohmann/json-schema.hpp>
#include <nlohmann/json.hpp>

#include "dc_measurements/measurement.hpp"
#include "dc_measurements/plugins/measurements/uptime.hpp"

namespace dc_demos
{
using json = nlohmann::json;

class UptimeCustom : public dc_measurements::Uptime
{
protected:
  void onFailedValidation(json data_json) override;
};

}  // namespace dc_demos

#endif  // DC_DEMOS__PLUGINS__MEASUREMENTS__UPTIME_CUSTOM_HPP_
We create a new class UptimeCustom, which inherits from dc_measurements::Uptime.
If we wanted to start a new measurement from scratch, it would inherit from dc_core::Measurement.
The method onFailedValidation is not mandatory but it is here to show it is possible to trigger a custom function when the validation fails.
Then the cpp code, currently located in dc_demos/plugins/measurements/uptime_custom.cpp:
#include "dc_demos/plugins/measurements/uptime_custom.hpp"

namespace dc_demos
{

void UptimeCustom::onFailedValidation(json data_json)
{
  (void)data_json;
  RCLCPP_INFO(logger_, "Callback! Validation failed for uptime custom");
}

}  // namespace dc_demos

#include "pluginlib/class_list_macros.hpp"
PLUGINLIB_EXPORT_CLASS(dc_demos::UptimeCustom, dc_core::Measurement)
We include the uptime_custom file header. Then, define the onFailedValidation function (triggered when validation fails).
The schema is picked up without any code: a Measurement validates against
plugins/measurements/json/<plugin type>.json from the package registering it, so dc_demos/UptimeCustom
reads dc_demos/plugins/measurements/json/uptime_custom.json. Set json_schema_path to point elsewhere, or
enable_validator: false to turn validation off.
Plugin file
Create the xml file, here will be measurement_plugin.xml for us, at the source of the package. It defines the plugins of the package.
<class_libraries>
    <library path="dc_uptime_custom_measurement">
        <class name="dc_demos/UptimeCustom" type="dc_demos::UptimeCustom" base_class_type="dc_core::Measurement">
            <description>
                dc_measurement_uptime_custom
            </description>
        </class>
    </library>
</class_libraries>
CMakeLists.txt
Now that you have all files set up, you can add the build process to the CMakeLists.txt:
# Measurement plugins
add_library(dc_uptime_custom_measurement SHARED
  plugins/measurements/uptime_custom.cpp
)
list(APPEND dc_measurement_plugin_libs dc_uptime_custom_measurement)

foreach(measurement_plugin ${dc_measurement_plugin_libs})
  ament_target_dependencies(${measurement_plugin} ${dependencies})
  target_link_libraries(
    ${measurement_plugin}
    nlohmann_json::nlohmann_json
    nlohmann_json_schema_validator
  )
  target_compile_definitions(${measurement_plugin} PRIVATE BT_PLUGIN_EXPORT)
endforeach()

pluginlib_export_plugin_description_file(dc_core measurement_plugin.xml)

install(FILES measurement_plugin.xml
  DESTINATION share/${PROJECT_NAME}
)

install(DIRECTORY plugins/measurements/
  DESTINATION share/${PROJECT_NAME}/plugins/measurements/
)
It creates the library, installs and exports it.
Console output
In the measurement server log, the plugin is detected properly
[component_container_isolated-1] [INFO] [1788506243.714587305] [measurement_server]: Creating measurement plugin uptime_custom: Type dc_demos/UptimeCustom, Group key: uptime, Polling interval: 5000, Debug: 0, Validator enabled: 1, Schema path: , Tags: [], Init collect: 1, Init Max measurement: 0, Include measurement name: 1, Include measurement plugin name: 0, Remote keys: , Remote prefixes: , Nest: 0, Flatten: 0, Include measurement plugin name: 0, Max measurement on condition: 0, If all condition: , If any condition: , If none condition: , Gate condition: , Buffer duration sec: 0, Post roll duration sec: 0, Cooldown sec: 0, Max flush rate hz: 0, Flush topic: /dc/flush
[component_container_isolated-1] [INFO] [1788506243.724443694] [measurement_server]: Done configuring uptime_custom
[component_container_isolated-1] [INFO] [1788506243.724997657] [measurement_server]: Looking for schema at /root/ws/install/dc_demos/share/dc_demos/plugins/measurements/json/uptime_custom.json
[component_container_isolated-1] [INFO] [1788506243.725045689] [measurement_server]: schema: {"$schema":"http://json-schema.org/draft-07/schema#","description":"Time the system has been up. Intentionally failing to demonstrate customization and callback","properties":{"time":{"description":"Time the system has been up","maximum":0,"type":"integer"}},"title":"Uptime Custom","type":"object"}
Then, it fails as expected:
[component_container_isolated-1] [ERROR] [1788506243.726002578] [measurement_server]: Validation failed: At /time of 1638628 - instance exceeds maximum of 0
[component_container_isolated-1] data={"time":1638628}
[component_container_isolated-1] [INFO] [1788506243.726050184] [measurement_server]: Callback! Validation failed for uptime custom
[component_container_isolated-1] [ERROR] [1788506248.725121430] [measurement_server]: Validation failed: At /time of 1638633 - instance exceeds maximum of 0
[component_container_isolated-1] data={"time":1638633}
[component_container_isolated-1] [INFO] [1788506248.725329122] [measurement_server]: Callback! Validation failed for uptime custom
Even though every Record fails validation, dc_bridge still ships the raw data to the
console Destination — validation failure only triggers onFailedValidation, it doesn't
drop the Record:
[dc_bridge-2] {"date":1788506243.7255764,"flattened":false,"host":"127.0.0.1","name":"uptime_custom","nested":false,"source_type":"fluent","tag":"dc.measurement.uptime_custom","time":1638628,"timestamp":"2026-09-04T07:17:23.725576334Z"}
Concepts
DC has a small, fixed vocabulary. Using it precisely makes the rest of the documentation — and the configuration files — unambiguous.
Glossary
| Term | Definition |
|---|---|
| Measurement | A source of sampled data (CPU, position, camera inspection…) that emits Records. |
| Record | One timestamped JSON document flowing through the pipeline. |
| Condition | A boolean predicate on robot state that gates whether a Measurement's Records are collected. |
| Trigger | A plugin that fires a one-shot signal on the false→true edge of a Condition composition, releasing a Measurement's pre-event buffer. Distinct from a Condition, which gates continuously. |
| FlushEvent | The message a Trigger broadcast node publishes when its Trigger fires, carrying the incident_id subscribed Measurements adopt. |
| Incident | One flush cycle — the pre-event window a Trigger released plus its post-roll — identified by the incident_id every Record and File of that cycle carries. |
| Group | A merge of Records from several Measurements into one Record, based on time proximity. |
| File | A binary artifact produced by a Measurement (image, video, map), uploaded to object storage as-is; only its metadata travels as a Record. |
| Destination | An external system that receives Records or Files (PostgreSQL, S3-compatible storage, console…). |
| Blessed Destination | A Destination DC configures natively from ROS parameters: postgres, s3, file, console, vector. |
| Passthrough Destination | A Destination configured by handing raw Shipper configuration through DC, unlocking the Shipper's full catalog without DC code. |
| Bridge | The DC component (dc_bridge) that receives Records from ROS topics and hands them to the Shipper. |
| Shipper | The external process (Vector by default) that buffers, transforms, and reliably delivers Records to Destinations. |
| Tag | A label carried by a Record naming the route it is delivered on. |
Relationships between them:
- A Measurement emits Records, optionally gated by one or more Conditions
- A Group merges Records from several Measurements into one Record
- The Bridge forwards every Record to the Shipper
- The Shipper delivers Records to one or more Destinations
- A File is uploaded to an object-storage Destination; its metadata becomes a Record
- A Record carries a Tag; each Tag names a route Destinations subscribe to
- A Trigger fires a FlushEvent; every Measurement listening for it releases its buffered window as one Incident
"Sink" is Vector's own term for an output configuration unit; DC's term for the same idea is Destination. "Route" is the Shipper-side path a Tag selects. A camera image is a File; the Record is the separate JSON document describing where that File went. A Condition is a level that gates collection while true; a Trigger is an edge that fires once, when a Condition composition flips from false to true.
ROS 2
ROS 2 is the core middleware used for DC. If you are unfamiliar with it, visit the ROS 2 documentation before continuing.
Records
A Record is a single data unit in JSON, published on a ROS topic as a
dc_interfaces/msg/StringStamped message. For example, a Record from the Memory
Measurement:
{
    "date": "2022-12-04T14:16:06.810999008",
    "flattened": false,
    "memory": {
        "used": 76.007431
    },
    "nested": true
}
flattened and nested are added to every Record unconditionally by the base
Measurement class — they report whether nested/flatten were configured for this
plugin, not something you opt out of showing.
The StringStamped message carries:
- header: ROS timestamp as
std_msgs/Header - data: the Record, as a JSON string
- group_key: the key this Record is nested under when merged into a Group
- incident_id: the Incident a released Record belongs to; empty outside an incident
The data string must be valid JSON:
"Robot_X:1.5, Robot_Y:1.8" # Not a valid Record
"{'x': 1.5, 'y': 1.8}"     # Valid Record
Timestamps
The timestamp is the time the Record was created. Measurements convert ROS time to a
UTC timestamp. Each Destination normalizes it into one field before delivery, controlled
by time_key (default date) and time_format (epoch_nanos, the default, for exact
integer nanoseconds since the epoch; iso8601 for a string; double for fractional
seconds, which rounds — see Destinations).
JSON validation
Each Record is validated against a JSON schema by default, following the
JSON Schema Validation
specification. Each Measurement ships its own schema, which can be overridden from a
custom package or disabled per Measurement with enable_validator: false. See
Data validation.
Bridge and Shipper
DC's data plane is an external Shipper process, Vector, fed
by the Bridge (dc_bridge) over a local socket. The Bridge renders the Shipper's
entire configuration from plain ROS parameters — see Destinations —
spawns and supervises the Shipper process, and forwards every Record it receives on its
configured input topics.
DC gets the Shipper's disk buffering, backpressure handling, retries, and native Destination support (PostgreSQL, S3-compatible storage, and many more) without embedding or forking it (ADR-0001, ADR-0002).
The wire format on the local Bridge↔Shipper socket (default port 24224) is Fluentd's
open "Forward" specification — chosen as the cheapest Shipper-native listener with
built-in receipt acknowledgement (ADR-0002).
No Fluentd or Fluent Bit software runs
anywhere in DC 2.0: the Bridge implements the sender side itself in a few hundred
lines of msgpack. The word "fluent" only appears in the generated Shipper config
(type = "fluent").
Tags
Every Record carries a Tag, derived mechanically from the topic it was published on:
the leading / is dropped and the remaining / become ..
| Topic | Tag | Public Shipper route |
|---|---|---|
/dc/measurement/uptime | dc.measurement.uptime | dc.dc.measurement.uptime |
/dc/group/robot | dc.group.robot | dc.dc.group.robot |
| (Uploader-internal) | dc.files | dc.dc.files |
Tags are what the Shipper routes on, and the dc.<tag> route names are
stable public API that
passthrough Destinations consume. A Destination selects what it receives through its own
inputs list of topics — Tags are derived from that, not configured directly.
Destinations
A Destination is where data ends up: a file is blessed (rendered from plain ROS parameters), and so is another Shipper, and (only for File uploads, not Records) S3-compatible storage. PostgreSQL, S3-compatible storage for Records, and the console are reached through a passthrough recipe instead of the ROS-param form (per ADR-0003); any other Vector sink is reachable through the passthrough too. See Destinations for the full contract.
dc_bridge:
  ros__parameters:
    destinations: ["records_log"]             # Destination names to enable
    records_log:                              # a name you choose
      type: file                              # a blessed type
      receives: records
      inputs: ["/dc/measurement/uptime"]      # the topics this Destination receives
      path: "/tmp/dc/records.ndjson"

measurement_server:
  ros__parameters:
    measurement_plugins: ["uptime"]
    uptime:
      plugin: "dc_measurements/Uptime"
      topic_output: "/dc/measurement/uptime"  # matched by the Destination's `inputs`
Conditions
A Condition enables or disables one or more Measurements. For example, collect camera images only when the robot is stopped. A Measurement can require that all, any, or none of a set of Conditions are active. See Conditions.
Triggers and incidents
A Condition can only give you data from the moment it turned true. When what matters is the
run-up to an event — the seconds before an emergency brake — a Trigger is the mechanism:
a Measurement holds its recent output in a rolling buffer instead of publishing it, and a
Trigger firing on the false→true edge of a Condition composition broadcasts a FlushEvent
that releases that buffer. Everything released by one firing, across every Measurement
listening, shares one incident_id. See Triggers.
Lifecycle Nodes and Bond
(Source: Nav2 documentation)
Lifecycle (or Managed, more correctly) nodes are unique to ROS 2. More information can be found here. They are nodes that contain state machine transitions for bringup and teardown of ROS 2 servers. This helps in deterministic behavior of ROS systems in startup and shutdown. It also helps users structure their programs in reasonable ways for commercial uses and debugging.
When a node is started, it is in the unconfigured state, only processing the node's constructor which should not contain any ROS networking setup or parameter reading. By the launch system, or the supplied lifecycle manager, the nodes need to be transitioned to inactive by configuring. After, it is possible to activate the node by transitioning through the activating stage.
This state will allow the node to process information and be fully setup to run. The configuration stage, triggering the on_configure() method, will setup all parameters, ROS networking interfaces, and for safety systems, all dynamically allocated memory. The activation stage, triggering the on_activate() method, will active the ROS networking interfaces and set any states in the program to start processing information.
To shutdown, we transition into deactivating, cleaning up, shutting down and end in the finalized state. The networking interfaces are deactivated and stop processing, deallocate memory, exit cleanly, in those stages, respectively.
The lifecycle node framework is used extensively through out this project and all servers utilize it. It is best convention for all ROS systems to use lifecycle nodes if it is possible.
Within DC, we use a wrapper of LifecycleNodes, nav2_util LifecycleNode from Nav2. This wrapper wraps much of the complexities of LifecycleNodes for typical applications. It also includes a bond connection for the lifecycle manager to ensure that after a server transitions up, it also remains active. If a server crashes, it lets the lifecycle manager know and transition down the system to prevent a critical failure. See Eloquent to Foxy for details.
The Bridge is deliberately not a lifecycle node and not under the lifecycle manager (ADR-0006): it must be up and its Shipper ready before the collection nodes are allowed to activate. See Data Pipeline.
See Lifecycle Manager for the managed-node list, the bond heartbeat and state-transition diagrams, and the autostart flow that ties into the Bridge readiness gate above.
Buffering and data persistence
The Shipper manages its own disk buffer (shipper.data_dir on the Bridge's parameters)
with a documented minimum size (shipper.buffer_max_bytes). This buffer persists across
reboots: Records accepted by the Bridge but not yet delivered to a Destination survive an
outage of that Destination, a robot reboot, or a Bridge restart, and are delivered — with
end-to-end acknowledgements — once the Destination is reachable again.
Scheduling and retries
The Shipper retries delivery to a Destination on failure with its own backoff, independent of DC code; see Vector's documentation for details. The Bridge itself is supervised by DC (launch respawn) and, in turn, supervises its own Shipper child process — including a Linux parent-death signal so the Shipper can never outlive the Bridge across a crash or SIGKILL.
Data Pipeline
This page follows one piece of data from the sensor that produced it to the external system that stores it. The vocabulary — Measurement, Record, Group, File, Bridge, Shipper, Destination, Tag — is defined in Concepts and used consistently throughout.
C4 model
Three levels, each zooming further into the pipeline: DC as a single system among external actors and destinations (Context), the processes that make it up (Container), and the pieces inside the Bridge (Component). The flowchart in the next section stays as the at-a-glance narrative view of a single Record's journey; these diagrams complement it rather than replace it.
DC and the systems it exchanges data with (C1)
DC runs as one system on the robot. A robot operator configures it; analytics and dashboard consumers read from whatever Destinations it was configured to write to — PostgreSQL, S3-compatible object storage, and (via passthrough, ADR-0003) any other Shipper-supported sink.
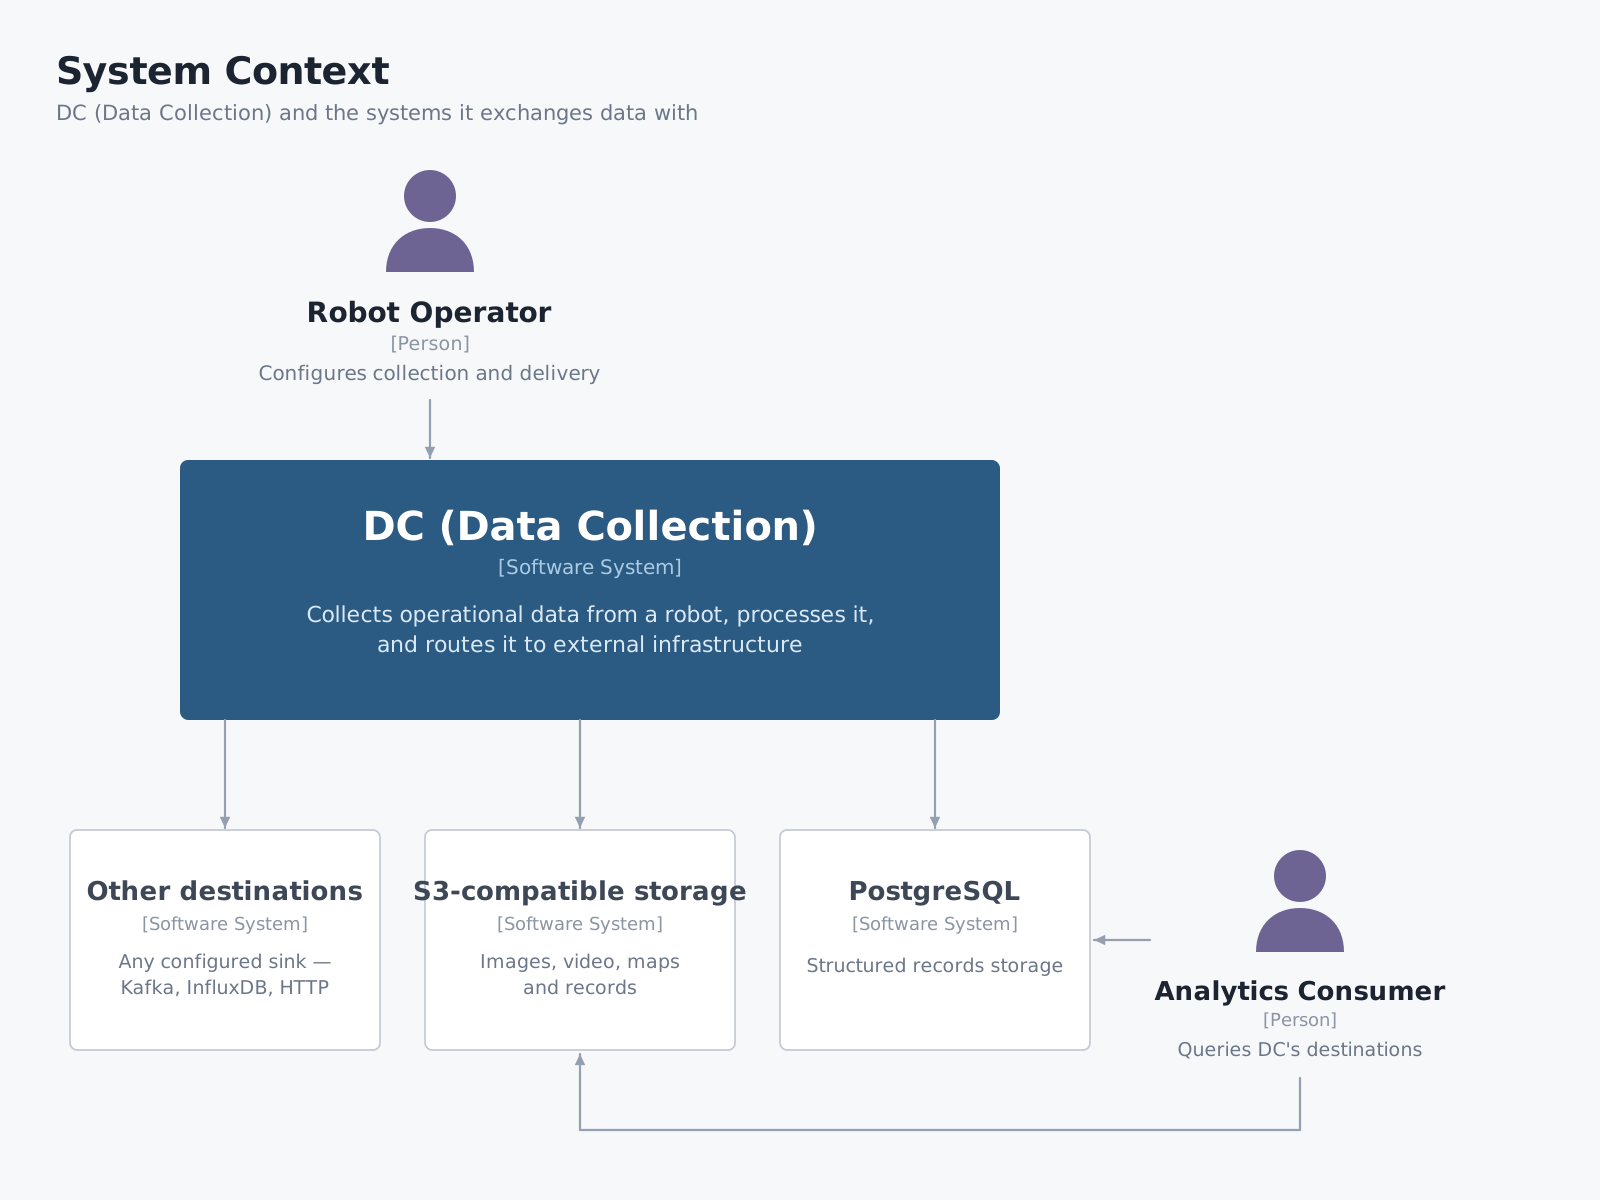
Inside DC (C2)
Inside DC, measurement_server is the node lifecycle-managed by
dc_lifecycle_manager (see Lifecycle Manager for the
managed-node list and why it's just the one node today). group_server runs as a plain
node alongside it, not under lifecycle management. The Bridge (dc_bridge) and its
supervised Shipper child are deliberately outside that boundary too
(ADR-0006) — the
Bridge has no meaningful deactivated state, so its readiness comes from launch ordering
(bridge_ready_gate) instead of a lifecycle transition. See
Deterministic startup ordering for the sequence this
diagram's bridge_ready_gate → dc_lifecycle_manager relationship summarizes.
dc_uploader is a fourth, independent process dc_bringup.launch.py starts
alongside the rest of the pipeline when a receives: files Destination is configured
(ADR-0014) — it uploads Files and
reports their status directly to the Shipper over its own connection, so an Uploader
crash or restart never touches Record collection.
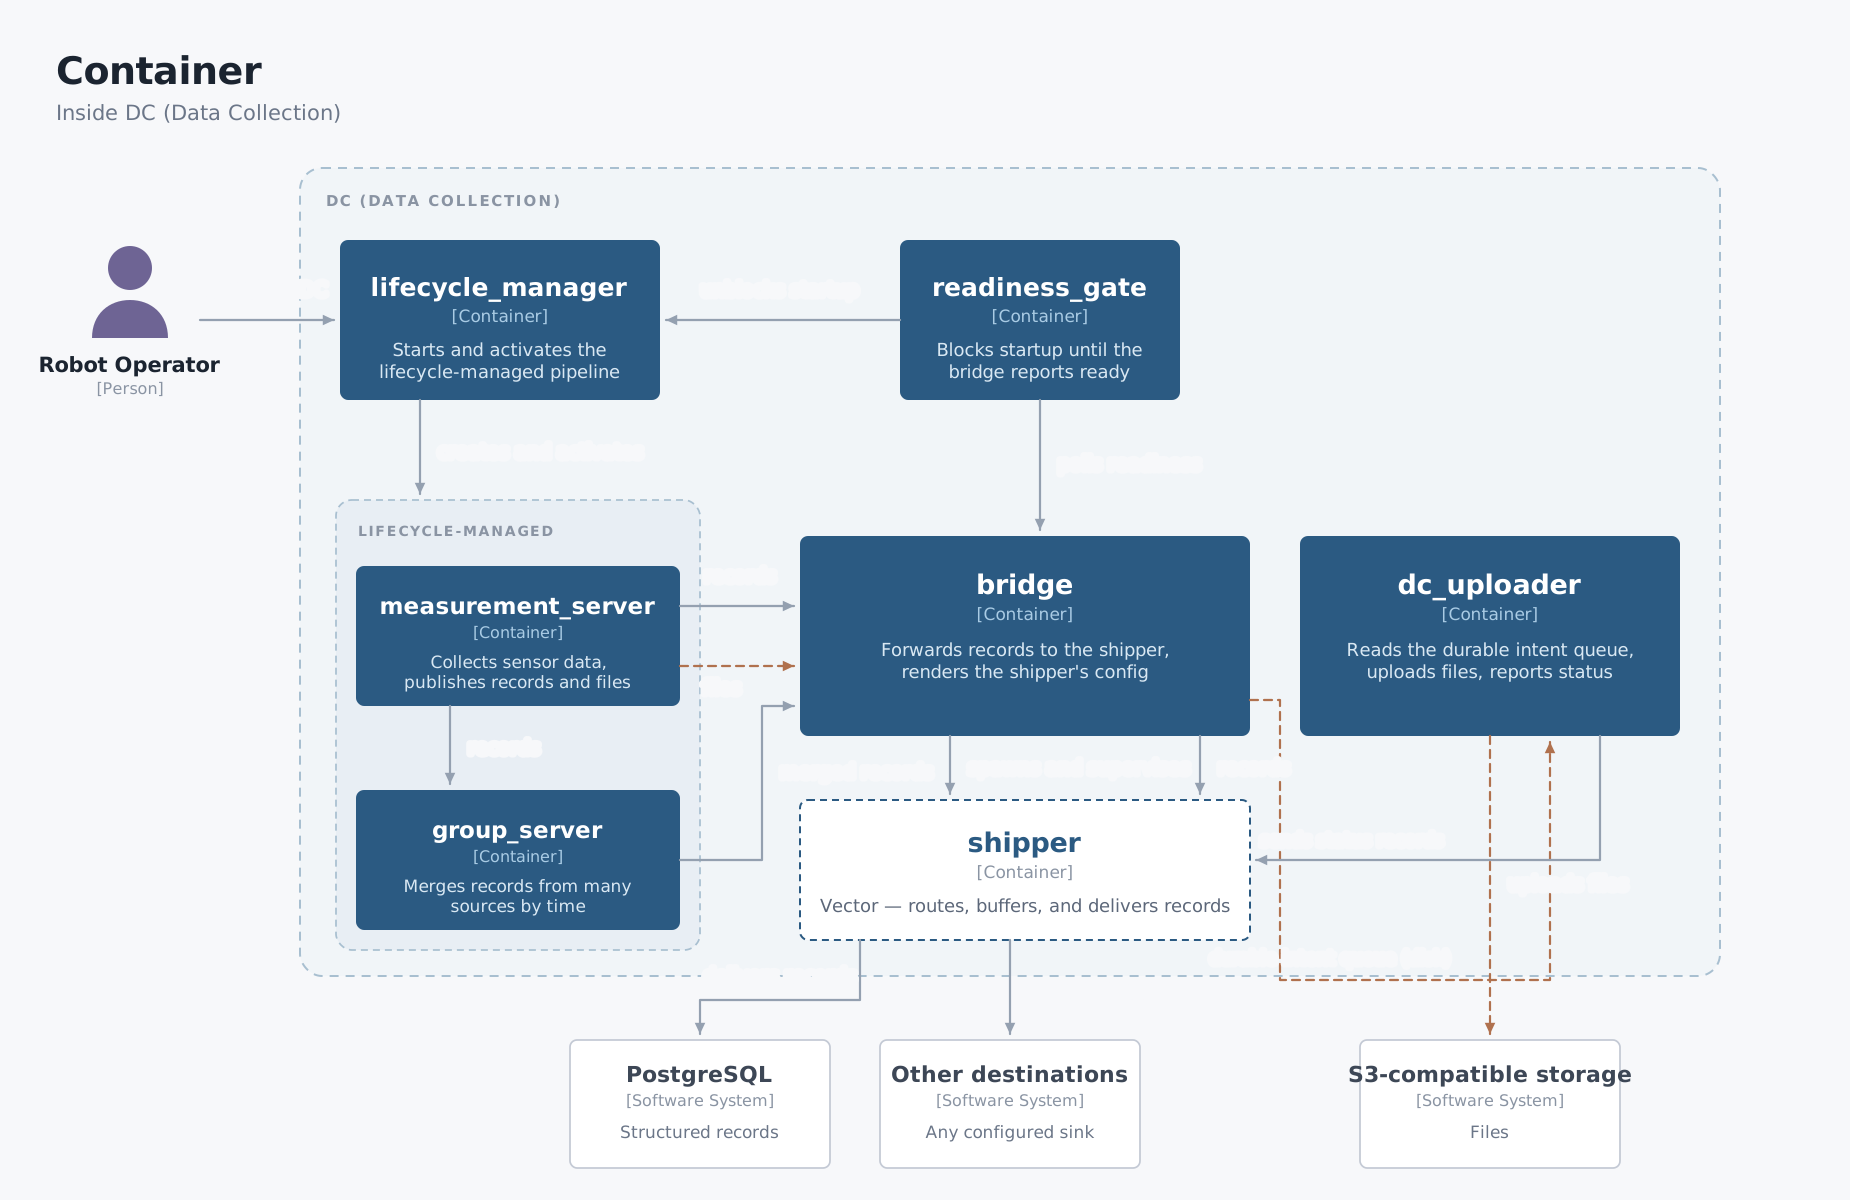
Inside dc_bridge and dc_uploader (C3)
The pieces added across #244–#267, now invisible from the outside: BridgeNode wires a
Forwarder (Records → Shipper), a Supervisor (owns the Vector child process), a Config
renderer (ADR-0003's
shipper/destinations params → Vector TOML, including passthrough snippet
validation), Readiness (backs ~/ready), and — for receives: files Destinations
(ADR-0005) — a durable
on-disk IntentQueue it enqueues into and forgets.
That queue is where the Bridge's responsibility for a File ends. dc_uploader
(ADR-0014) is a separate process —
its own executable, no rclcpp/rclpy dependency — that rescans the same on-disk
queue, uploads Files against an S3-compatible ObjectStore, and reports status Records
over its own Forwarder/Shipper connection under the dc.files Tag, entirely
independent of the Bridge's own Forwarder. Killing or restarting dc_uploader never
touches Record collection, since there is no shared address space left for it to take
down.
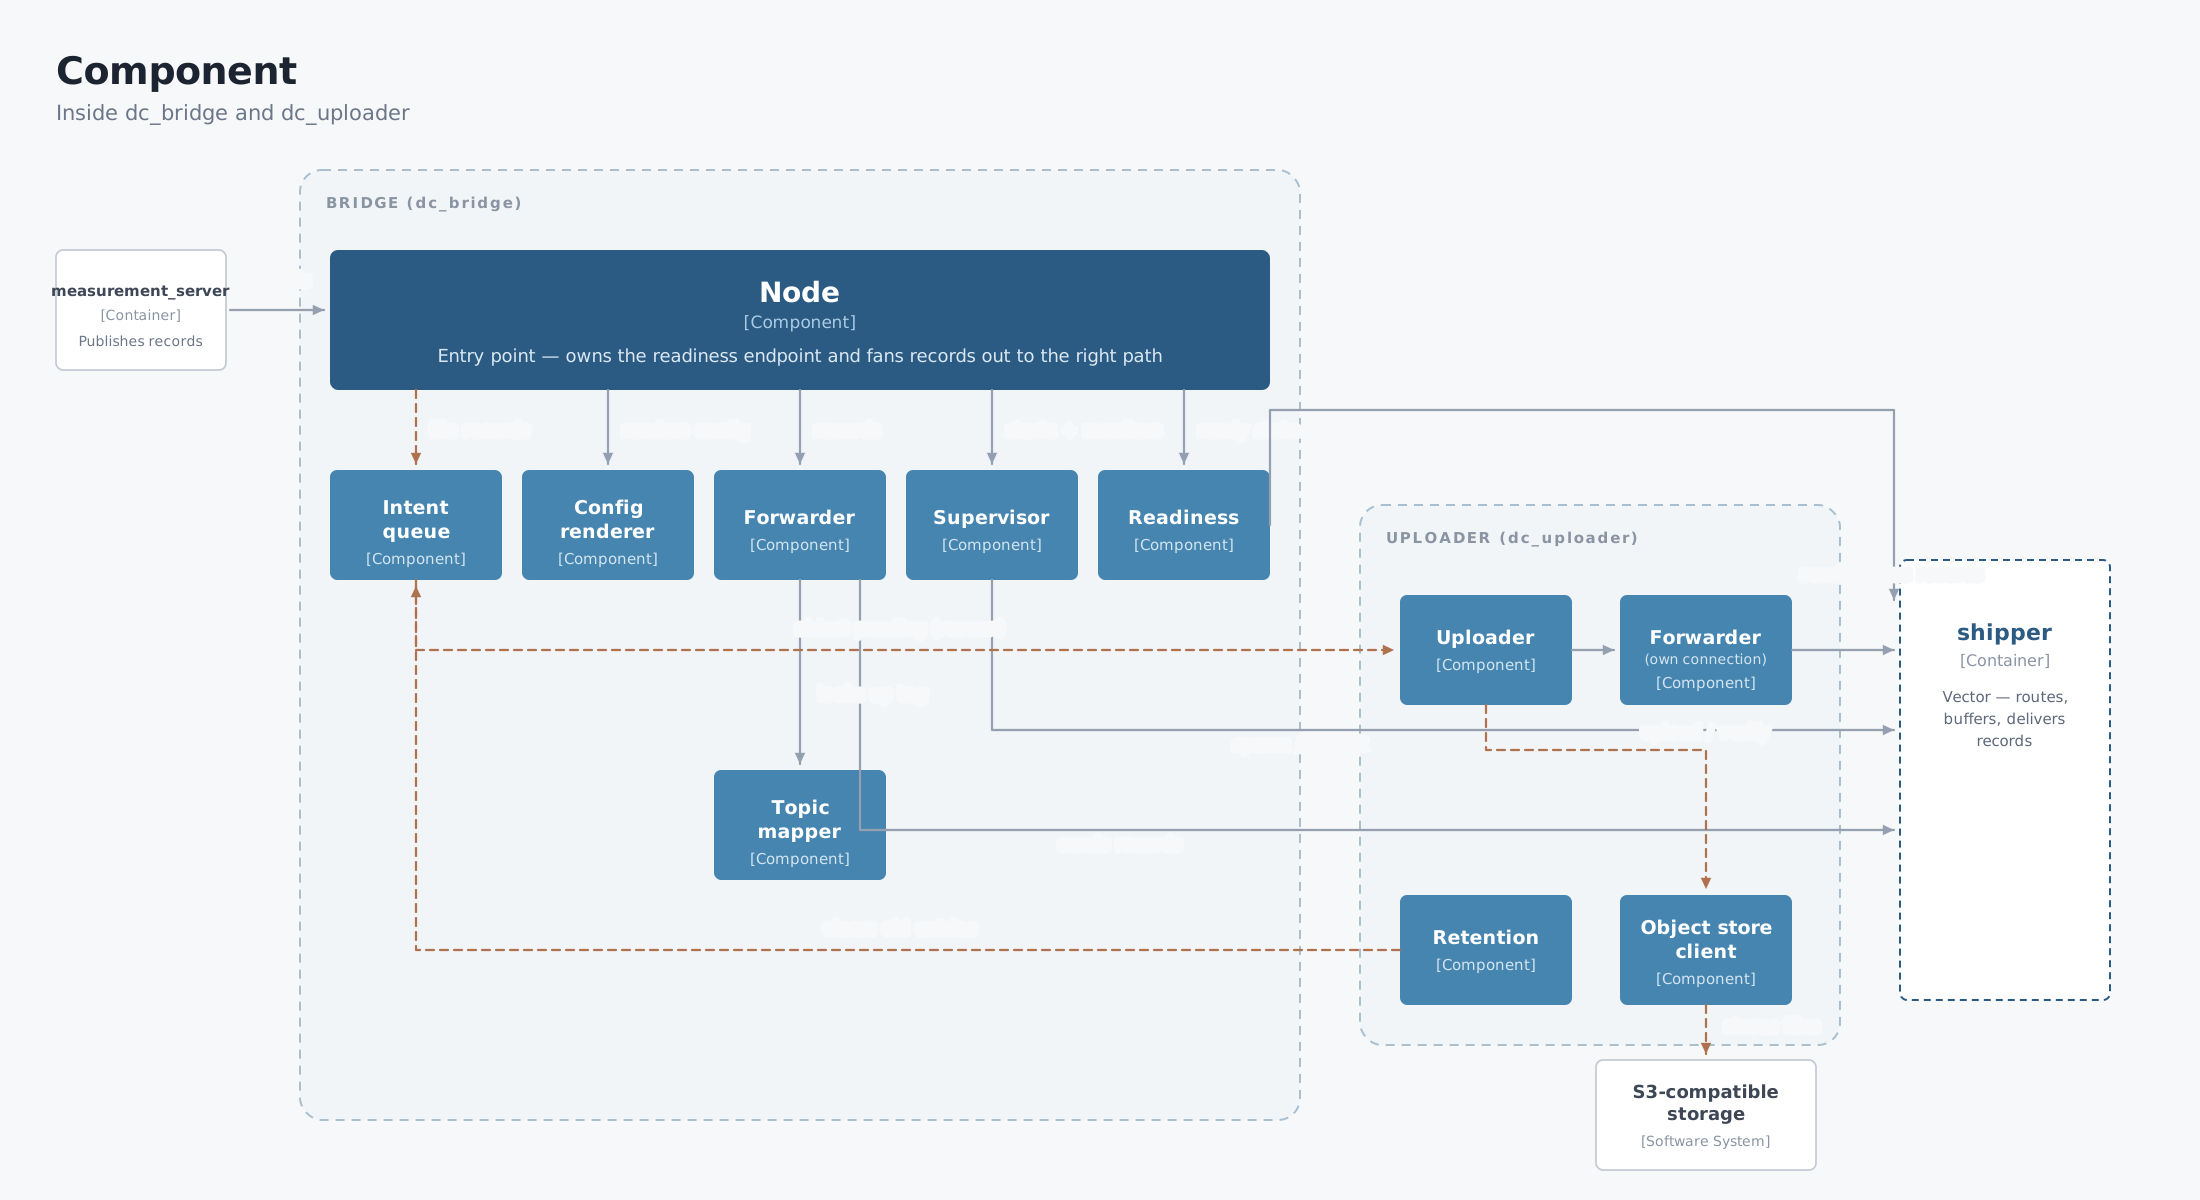
The path of a Record
flowchart LR
subgraph ros["ROS 2 graph"]
meas["Measurement plugins<br/>(measurement_server)"]
cond["Conditions"]
group["Group node<br/>(group_server)"]
end
subgraph bridge["Bridge (dc_bridge)"]
fwd["Forwarder"]
iq[("Intent queue<br/>(disk)")]
end
subgraph uploader["dc_uploader (own process)"]
upl["Uploader"]
ufwd["Forwarder<br/>(own connection)"]
end
subgraph shipper["Shipper (Vector)"]
route["dc.<tag> routes"]
buf[("Disk buffer")]
end
subgraph dest["Destinations"]
pg["PostgreSQL"]
s3["S3-compatible storage"]
other["Any Vector sink<br/>(passthrough)"]
end
cond -- gate --> meas
meas -- "Records (StringStamped)" --> fwd
meas -- "Records" --> group
group -- "merged Records" --> fwd
meas -. "Files on disk" .-> fwd
fwd -. "enqueues intent" .-> iq
iq -. "rescans (poll)" .-> upl
fwd -- "shipper ingest protocol" --> route
route --> buf
buf --> pg
buf --> other
upl -- "File bytes" --> s3
upl -- "status Record" --> ufwd
ufwd -- "dc.files, its own connection" --> route
- A Measurement produces a Record. Each Measurement plugin samples its source on a
timer (or on an input topic) and publishes one timestamped JSON document as a
dc_interfaces/msg/StringStampedon itstopic_output. Conditions can gate whether the Measurement collects at all. - Optionally, a Group merges Records. The Group node subscribes to several
Measurement topics and publishes one merged Record on
/dc/group/<name>once their timestamps line up (sync_delay). - The Bridge forwards every Record.
dc_bridgesubscribes to every topic listed in any Destination'sinputs, derives that topic's Tag, and hands the Record to the Shipper over the local shipper ingest socket (default127.0.0.1:24224), with receipt acknowledgement. - The Shipper routes, buffers and delivers. Vector normalizes the Record's
timestamp field, exposes it on the public
dc.<tag>route, writes it to a persistent disk buffer, and delivers it to each Destination wired to that route — retrying with its own backoff until it succeeds. - Files take a different path. A File (camera image, map, video) is never sent
through the Shipper.
dc_bridgeparses thelocal_paths/remote_pathsreferences embedded in the Record and durably enqueues an intent to a shared on-disk queue — then forgets it.dc_uploader, a separate process (ADR-0014), rescans that same queue, uploads the bytes to object storage, verifies them, and emits a status Record under thedc.filesTag over its own Shipper connection — which then travels the ordinary Record path. See File uploads.
Where each piece is configured
| Stage | Node | Parameters |
|---|---|---|
| Producing Records | measurement_server | Measurements |
| Gating collection | measurement_server | Conditions |
| Merging Records | group_server | Groups |
| Routing, buffering, delivering | dc_bridge | Destinations |
| Uploading Files, reporting status | dc_uploader | File uploads |
Routing is decided in exactly one place: a Destination's inputs list names the topics
it receives. Nothing on the producing side selects a Destination.
Deterministic startup ordering
dc_bringup.launch.py brings the pipeline up in a fixed order
(ADR-0006), so no Record
can be emitted before the pipeline is able to accept it:
- Bridge first.
dc_bridgestarts as a plain node (outside the lifecycle manager) and spawns the Vector Shipper as a supervised child process.dc_uploaderstarts alongside it at this same step, as its own process, unless therun_uploaderlaunch argument isFalse(ADR-0014) — it isn't gated by readiness the way the collection nodes are, since it has nothing to wait for beyond the on-disk intent queue it rescans. The measurement server also starts here, but stays unconfigured and inactive — its publishers cannot emit anything yet. - Readiness gate. A
bridge_ready_gateprocess blocks, polling the Bridge's~/readyservice (std_srvs/Trigger), which answerssuccess=Trueonly once the Shipper is accepting connections on its ingest socket. The gate'sservice,timeout_s(default 120 s), andpoll_interval_sparameters are configurable from the params file underbridge_ready_gate:. - Activation. Only when the gate exits successfully does the launch start
lifecycle_manager_dc, which configures and then activates the collection nodes. If the Bridge never becomes ready before the gate's deadline, the whole launch shuts down loudly instead of leaving a half-started pipeline running.
See Lifecycle Manager for the diagrammed version of this sequence, plus the state transitions and bond-heartbeat recovery behavior it drives once activated.
Durability and supervision
- Disk buffering. The Shipper owns a persistent disk buffer at
shipper.data_dir. A Record the Bridge has handed over survives a Destination outage, a Bridge restart, and a robot reboot; delivery resumes — with end-to-end acknowledgements — once the Destination is reachable again. - Backpressure. When a Destination is slow, the Shipper stops acknowledging, and the Bridge propagates that backwards rather than dropping data silently.
- Supervision. The launch file respawns
dc_bridgeunconditionally (independent ofuse_respawn), and the Bridge supervises its Shipper child — including a Linux parent-death signal, so the Shipper can never outlive the Bridge even across a SIGKILL or crash. - The one lossy window. Records published while the Bridge is down are dropped: ROS topics are fire-and-forget and nothing buffers upstream of the Bridge. Delivery resumes as soon as the respawned Bridge is ready.
- Delivery semantics. At-least-once. After a crash or an induced outage, a boundary Record may be re-sent; deduplicate on read if that matters to you.
- File uploads survive an Uploader crash. An intent is only removed from the disk
queue after a successful upload is acknowledged; killing
dc_uploadermid-upload loses nothing; the next start replays the same intent from disk.
Data validation
Model
Each Measurement can validate the Records it emits against a model.
We use use JSON schema validator for JSON for Modern C++.
Schemas follow the JSON 7 model:
{
    "$schema": "http://json-schema.org/draft-07/schema#",
    "title": "Uptime",
    "description": "Time the system has been up",
    "properties": {
        "time": {
            "description": "Time the system has been up",
            "type": "integer",
            "minimum": 0
        }
    },
    "type": "object"
}
Validation is enabled by default (enable_validator: true); disable it per plugin
with enable_validator: false when fields are filtered out or added dynamically (e.g.
remote paths) in a way the shipped schema doesn't account for.
Failed validation callback
You might want to trigger some actions when a validation fails, e.g send the data to another database to later on debug it.
In this case, you will need to write your own plugin (inherit from an existing one or start from scratch) and define the onFailedValidation function in the class.
This case is covered by the custom plugin demo
Use a different Schema
For each plugin, a default path is provided but this can be changed by passing the json_schema_path parameter in the measurement plugin parameter to the absolute path of your schema.
Groups
Description
A Group merges the Records of several Measurements into one Record, based on time
proximity. For example, grouping the cpu and position Measurements publishes a single
merged Record on /dc/group/my_group:
{
    "cpu": ...,
    "position": ...,
}
A merged Record is an ordinary Record from there on: it carries the Tag derived from its
output topic, and a Destination receives it by listing that topic in inputs.
Envelope fields do not get nested under a member's key: a member's tags is replaced by the
Group's own, and the incident_id on its envelope — the id a Measurement stamps on a Record
it released as part of an incident — is carried onto the merged Record's
own envelope (first non-empty wins, so a partial Record built from a mix of released and live
members still carries it). The Bridge lifts that envelope field into the payload's top level,
where a postgres Destination has a column for it; buried under <group_key>.incident_id it
would simply be dropped by that sink. A member payload that is not a JSON object — a bare
scalar or an array — has no such fields to lift, and is merged as it is under its
group_key.
The Group node is written in Python: allocating and passing a variable number of inputs to
the ApproximateTimeSynchronizer is straightforward there and awkward in C++.
Node parameters
| Parameter | Description | Type | Default |
|---|---|---|---|
| groups | Groups to enable | list[str] | N/A |
| group_measurement_plugins | Collect the members' plugin fields into the merged Record's plugins list | bool | true |
Group parameters
| Parameter | Description | Type | Default |
|---|---|---|---|
| inputs | Name of the input topics to group | list[str] | N/A |
| output | Output topic to send the data to | str | "/dc/group/{group}" |
| sync_delay | Delay to wait during all subscriber data need to reach before being published again | float | 5.0 |
| sync_timeout | Seconds an incomplete set may wait before on_sync_timeout applies. 0.0 disables it | float | 0.0 |
| on_sync_timeout | What to do with an incomplete set once sync_timeout elapses: drop/emit_partial | str | "drop" |
| sync_timeout_log_throttle | Seconds between two sync-timeout warnings for this group. 0.0 logs every one | float | 60.0 |
| group_key | Dictionary key under which data is grouped | str | {group_name} |
| exclude_keys | List of keys to exclude from the published data. Data depth is separated by a dot. An entry holding glob syntax (*, ?, [seq]) is a glob over the flattened key, one without is a key prefix | list[str] | N/A |
| nested_data | Whether measurements are nested dictionaries or flat | bool | true |
| include_group_name | Include group name in the JSON as key="name" and value=<group_key> | bool | true |
Incomplete sets
A Group only publishes once every one of its inputs has produced a Record close enough
in time. If one Measurement stops publishing — a camera unplugged, a plugin crashed, a
gate_condition that never opens — the whole Group goes silent, and the Records of the
inputs that are working never reach a Destination.
sync_timeout puts a deadline on that wait. It is measured from the arrival of the first
Record of a set, and it is a different thing from sync_delay: sync_delay is the
synchroniser's slop, the maximum spread between the timestamps of Records that may be
merged together, whereas sync_timeout is real time spent waiting for a set to complete.
sync_timeout | on_sync_timeout | Behaviour |
|---|---|---|
0.0 | (ignored) | No deadline. The Group waits indefinitely and the synchroniser evicts stale Records on its own |
> 0.0 | drop | The incomplete set is discarded when the deadline elapses. Nothing is published, a warning is logged |
> 0.0 | emit_partial | The Records that did arrive are published as one partial Record, then the set is discarded |
drop is the default, so a Group that sets nothing new behaves exactly as it did before.
emit_partial needs a positive sync_timeout to have a deadline to fire on; configured
without one, the Group logs an error and falls back to drop.
The deadline is on the set as a whole, not on each input: it starts with the first Record of a set and later Records do not push it back. After a set times out, the Group forgets every Record it was holding, so a Record already published in a partial set is never merged a second time when its late partner finally arrives.
Warnings and throttling
Every timeout logs a warning naming the group, the deadline it missed, and the input
topics that produced nothing — including under drop, where the warning is the only trace
left since nothing is published:
[WARN] [group_server]: Group 'memory_cpu': no complete set after 10.0s, dropping the
incomplete set (no Record from: ['/dc/measurement/memory'])
A Measurement that dies stays dead, so the group keeps timing out and an unthrottled
warning would repeat every sync_timeout for as long as the robot runs.
sync_timeout_log_throttle caps this at one warning per group per window (60s by default);
set it to 0.0 to log every timeout. The first timeout after a quiet window always logs
immediately, and reports how many warnings the throttle swallowed since the last one:
[WARN] [group_server]: Group 'memory_cpu': no complete set after 10.0s, dropping the
incomplete set (no Record from: ['/dc/measurement/memory']) [+5 more in the last 60.0s]
The throttle is per group, so a permanently broken group does not silence the warnings of a
healthy one that starts failing. Only the log line is rate-limited — under emit_partial
every timeout still publishes its partial Record, throttled or not.
What a partial Record looks like
A partial Record has the same shape as a complete one, minus the inputs that did not report, plus two keys that mark it as partial:
{
    "cpu": { "used": 12.0 },
    "partial": true,
    "missing_inputs": ["/dc/measurement/memory"],
    "tags": [""],
    "name": "memory_cpu"
}
- A missing input's key is omitted, not present-and-null. The Group node knows a
missing input's topic and nothing else: a Record's
group_keyand its fields both travel inside the Record itself, so there is no correctly shaped null placeholder the Group could invent for a Measurement that never published. Consumers with a flat column schema — thepostgressink maps a Record's top-level keys onto existing columns — see those columns stayNULLfor that row, the same as any other column a Record does not populate. partialandmissing_inputsappear only on partial Records. A complete Record is byte-for-byte what the Group published before this option existed, so nothing downstream has to change to keep consuming complete Records. Treat the absence ofpartialasfalse.missing_inputslists the input topics that contributed no Record, ininputsorder.tags,nameandpluginsbehave as they do on a complete Record —pluginsonly lists the plugins that actually reported.incident_idbehaves the same way: if any member that did arrive was released as part of an incident, the merged Record carries itsincident_id, so a partial Record of an incident is still queryable as one.
Vector's postgres sink silently drops top-level keys that have no matching column, so
partial and missing_inputs are discarded unless you add partial boolean and
missing_inputs jsonb to the destination table yourself.
Example
group_server:
  ros__parameters:
    groups: ["memory_cpu", "memory_uptime", "cameras", "map"]
    memory_cpu:
      inputs: ["/dc/measurement/memory", "/dc/measurement/cpu"]
      output: "/dc/group/memory_cpu"
      sync_delay: 5.0
      group_key: "memory_cpu"
    memory_uptime:
      inputs: ["/dc/measurement/memory", "/dc/measurement/uptime"]
      output: "/dc/group/memory_uptime"
      sync_delay: 5.0
      # Publish whatever arrived rather than nothing if one of the two is 10s late
      sync_timeout: 10.0
      on_sync_timeout: "emit_partial"
      group_key: "memory_uptime"
    cameras:
      inputs: ["/dc/measurement/camera"]
      output: "/dc/group/cameras"
      sync_delay: 5.0
      group_key: "cameras"
    map:
      inputs: ["/dc/measurement/map"]
      output: "/dc/group/map"
      sync_delay: 5.0
      group_key: "map"
Lifecycle Manager
dc_lifecycle_manager is DC's nav2-style manager for the nodes that have a meaningful
deactivated state. It walks each managed node through the ROS 2 managed-node state
machine (configure,
activate, deactivate, cleanup, shutdown), watches a bond heartbeat on every node
it has activated, and can bring the whole managed set up automatically at launch. See
Concepts for the general nav2_util
LifecycleNode background this page builds on.
The Bridge (dc_bridge) is deliberately not one of the managed nodes
(ADR-0006): it
has no meaningful deactivated state, so its readiness is a launch-ordering problem
instead — see the boundary and autostart flow
below.
What it manages
The set of managed nodes is the node_names parameter, walked in list order for
bring-up (configure then activate, each transition applied to every node before the
next one starts) and in reverse order for teardown. In every params file this repo
ships — dc_bringup.launch.py's inline lifecycle_manager_params and both E2E harness
params files — that list is:
lifecycle_manager_dc:
  ros__parameters:
    node_names: ["measurement_server"]
    transitions: [configure, activate]
measurement_server is the only node under lifecycle management today.
group_server, when enabled, is launched as a plain Node alongside it — not added to
node_names — so it is not lifecycle-managed. Nothing stops a future node_names entry
from adding it if it ever needs a deactivated state; the manager is already list-driven
for exactly that reason.
The boundary and the autostart flow
dc_bringup.launch.py brings the pipeline up in a fixed order
(ADR-0006) so that no
Record can be emitted before the Bridge can accept it. The Bridge, its Vector Shipper
child, and the bridge_ready_gate process that polls the Bridge's ~/ready
(std_srvs/Trigger) service all run outside lifecycle_manager_dc — only once the
gate exits 0 does the lifecycle manager exist at all in the launch graph.
flowchart TB
    subgraph outside["Outside the lifecycle manager (ADR-0006)"]
        direction TB
        vector["Vector<br/>(Shipper child process)"]
        bridge["dc_bridge<br/>(plain node, launch respawn)"]
        gate["bridge_ready_gate<br/>(polls ~/ready)"]
        bridge -- "spawns and supervises" --> vector
        bridge -- "~/ready (std_srvs/Trigger)" --> gate
    end
    subgraph managed["Managed by lifecycle_manager_dc"]
        direction TB
        lm["lifecycle_manager_dc<br/>(autostart=true by default)"]
        meas["measurement_server<br/>(only entry in node_names)"]
        lm -- "configure, then activate" --> meas
        meas -- "bond heartbeat (10 Hz)" --> lm
    end

    gate -- "exit 0: Bridge ready" --> lm
    gate -. "exit != 0: never ready" .-> abort["Shutdown(reason=...)<br/>whole launch aborts"]
- Bridge first.
dc_bridgestarts as a plain node and spawns Vector as a supervised child process. - Readiness gate.
bridge_ready_gateblocks until~/readyanswerssuccess=True(Vector accepting connections on its ingest socket), or its owntimeout_s(default 120 s) expires. - Activation, only on success.
dc_bringup.launch.pyregisters anOnProcessExithandler on the gate: exit0startslifecycle_manager_dc; any other exit code shuts the whole launch down (Shutdown(reason=...)) instead of leaving collection nodes running against a Bridge that never came up. - Autostart.
dc_bringup.launch.py'sautostartlaunch argument defaults toTrueand is always passed through explicitly — overriding the code's own default offalsefor a manager launched some other way. Withautostart=true,lifecycle_manager_dccalls its ownstartup()as soon as it has constructed lifecycle service clients for every managed node, with no external service call needed.autostart=falseleaves the managed set inUnconfigureduntil something calls the manager's~/manage_nodesservice (nav2_msgs/srv/ManageLifecycleNodes, commandSTARTUP).
State transitions and bond heartbeats
Each managed node moves through the same five primary states nav2 uses. The manager's
five service-level operations (startup, shutdown, reset, pause, resume) are
each just a sequence of these per-node transitions applied across every managed node —
pause/resume reuse the same deactivate/activate edges startup uses, not
separate ones.
A bond (10 Hz heartbeat, bond_timeout — 10 s in dc_bringup.launch.py, 4 s
default otherwise) is created for a node the moment it activates and torn down the
moment it deactivates. The manager polls every bond every 200 ms; a missed heartbeat
past bond_timeout is treated as that node having crashed.
stateDiagram-v2
    [*] --> Unconfigured
    Unconfigured --> Inactive: configure
    Inactive --> Active: activate / resume
    Active --> Inactive: deactivate / pause
    Inactive --> Unconfigured: cleanup
    Unconfigured --> Finalized: shutdown
    Finalized --> [*]

    Active --> Unconfigured: bond heartbeat lost -> reset(hard_reset=true)
    Unconfigured --> Active: node reachable again within\nbond_respawn_max_duration -> startup()
A lost heartbeat does not just deactivate the one node that crashed — checkBondConnections
hard-resets every managed node (deactivate then cleanup, continuing past
per-node failures since hard_reset=true) and clears all bonds, on the principle that a
half-alive managed set is worse than a fully torn-down one. If
attempt_respawn_reconnection (default true) is set, a 1 s-period timer then polls
whether every managed node's lifecycle service is reachable again:
- Reachable within
bond_respawn_max_duration(default 10 s): the manager callsstartup()again — a fullconfigure+activatepass — and resumes normal operation, bonds included. - Still unreachable once
bond_respawn_max_durationelapses: the manager gives up and leaves the managed setUnconfigured. Recovery from there needs an explicitSTARTUPcall to~/manage_nodes(or a relaunch).
~/is_active (std_srvs/srv/Trigger) reports whether the managed set is currently
Active, and a diagnostic_updater entry surfaces the same status on /diagnostics.
Measurements
Description
A Measurement is a source of sampled data that emits Records — timestamped JSON documents — on its own ROS topic. For example, a Record from the Memory Measurement:
{
    "flattened": false,
    "memory": {
        "used": 76.007431
    },
    "nested": true,
    "run_id": "358"
}
flattened/nested/run_id are added unconditionally by this node — see below. Fields
like robot_name only appear once configured as a custom key (see
custom_key_str_list above), and date/host/source_type/tag/
timestamp are added later, by Vector once the Bridge forwards the Record — see a
captured example on any demo page for the full shape a Destination
actually receives.
Node parameters
This node collects data and publishes it as Records. Each Measurement is a pluginlib
plugin loaded into this node and publishes on its own topic_output; the Bridge
(dc_bridge) subscribes to those topics and forwards the Records to the Destinations
that list them in inputs (see Destinations). Conditions are
pluginlib plugins loaded here too — optional predicates that gate whether a Measurement
collects, e.g. only when the robot is not moving.
| Parameter name | Description | Type(s) | Default |
|---|---|---|---|
| measurement_plugins | Name of the measurement plugins to load | list[str] | N/A (mandatory) |
| condition_plugins | Name of the condition plugins to load | list[str] | [] |
| save_local_base_path | Path where files will be saved locally (e.g camera images). Expands $X to environment variables and =Y to custom string parameters | str | "$HOME/ros2/data/%Y/%M/%D/%H" |
| all_base_path | Path where files will be saved at their destination (S3, RustFS...). Expands $X to environment variables and =Y to custom string parameters | str | "" |
| custom_key_str_list | Custom strings to use in other parameters. They are also appended in the json sent to the destination, and to the File metadata Records of the same Measurement | list[str] | N/A |
| custom_keys_str.force_override | Override values if the keys are already present in the measurement. Applies to all and can be overridden by custom_keys_str.<param_name>.force_override | bool | false |
| custom_keys_str.<param_name>.name | Key to add in the serialized data | str | N/A (optional) |
| custom_keys_str.<param_name>.value | Value to set for the key as a fixed string | str | N/A (optional) |
| custom_keys_str.<param_name>.value_from_file | Path to a file containing the value to set | str | N/A (optional) |
| custom_keys_str.<param_name>.force_override | Override value if the key is already present in the measurement | bool | false |
| run_id.enabled | Identify which run the robot is. A new one is generated at every start of the node. Uses either a counter or UUID | bool | true |
| run_id.counter | Enable counter for the run_id | bool | true |
| run_id.counter_path | Path to store the last run. It is expanded with environment variables id | str | "$HOME/run_id" |
| run_id.uuid | Generate a new run ID by using a random UUID | bool | false |
robot_name resolution
robot_name is a custom key like any other, but when it appears in custom_key_str_list
its value resolves in a fixed order rather than always being a literal string, so a fleet
does not need one hand-edited params file per robot:
custom_keys_str.robot_name.value— a literal string, unchanged from before.custom_keys_str.robot_name.value_from_file— the contents of a file, e.g. one written by the provisioning process.- The machine's hostname — the default when neither of the above is set.
A value_from_file that names a file that cannot be read, or any source that resolves to
an empty string, fails node configuration with a clear error rather than shipping Records
with a missing or blank robot_name.
Custom keys on Files
The keys listed in custom_key_str_list label a Measurement's Files as well as its
Records: dc_uploader (ADR-0014, a
separate process from the Bridge) writes them into the file_status and group_complete
Records it emits for that Measurement's Files, so both sides of a Destination carry the
same labelling. A Record names its custom keys in a custom_keys field for that purpose.
Two limits are worth knowing. A custom key whose name is one the Uploader computes itself
(group_name, local_path, remote_path, storage_type, uploaded, size, …) is not
written — the Uploader's own value is kept and dc_uploader logs the collision. The keys the
rows already carry, robot_name and id (as robot_id), are likewise not repeated, and
are not reported: those values are in the row either way. And the column still has to exist
in the Destination: the PostgreSQL sink maps JSON keys onto existing columns 1:1, so a new
custom key needs an ALTER TABLE on dc_files the same way it needs one on dc_records.
Plugin parameters
Each measurement is collected through a node and has these configuration parameters:
| Parameter name | Description | Type(s) | Default |
|---|---|---|---|
| buffer_duration_sec | Seconds of history to buffer instead of publishing live; 0 disables buffering and preserves normal live publishing | float | 0 |
| condition_max_measurements | Collect a maximum of n measurements when conditions are activated (-1 = never, 0 = infinite) | int | 0 |
| cooldown_sec | Seconds to ignore further FlushEvents once post-roll ends, before buffering re-arms itself; 0 re-arms immediately | float | 0 |
| debug | More verbose output | bool | false |
| enable_validator | Will validate the data against a JSON schema | bool | true |
| flush_topic | Topic to receive the FlushEvent (see Triggers) that releases the buffered window, tagging each Record with the event's incident_id | str | "/dc/flush" |
| gate_condition | Name of a Condition that must become true once before any collection is published; then latches open permanently and is never consulted again | str | N/A (optional) |
| group_key | Value of the key used when grouped | str | "" (Optional) |
| if_all_conditions | Collect only if all conditions are activated | list[str] | N/A (optional) |
| if_any_conditions | Collect if any conditions is activated | list[str] | N/A (optional) |
| if_none_conditions | Collect only if all conditions are not activated | list[str] | N/A (optional) |
| include_measurement_name | Include measurement name in the JSON data | bool | true |
| include_measurement_plugin | Include measurement plugin name in the JSON data | bool | false |
| init_collect | Collect when the node starts instead of waiting the first tick | bool | true |
| init_max_measurements | Collect a maximum of n measurements when starting the node (-1 = never, 0 = infinite) | int | 0 |
| json_schema_path | Path to the JSON schema, ignored if empty string | str | N/A (optional) |
| max_flush_rate_hz | Ceiling on how fast the buffered window is emitted once a flush releases it; 0 releases the whole window in one burst | float | 0 |
| plugin | Name of the plugin to load | str | N/A (mandatory) |
| polling_interval | Interval to which data is collected in milliseconds | int (>=100) | 1000 |
| post_roll_duration_sec | Seconds to keep publishing live after a flush, still tagged with the same incident_id; 0 means pre-roll only | float | 0 |
| remote_keys | Destination names the Files this Measurement produces are uploaded to; each becomes a key under the Record's remote_paths | list[str] | N/A (optional) |
| remote_prefixes | Prefixes to apply to the remote paths of the Files this Measurement produces | str | N/A (optional) |
| topic_output | Topic where result will be published | str | "/dc/measurement/<measurement_name>" |
When buffer_duration_sec is set above 0, this Measurement stops publishing live: each
collected sample is instead pushed into an in-memory ring buffer covering the last
buffer_duration_sec seconds. A FlushEvent on flush_topic (published by a dc_triggers
broadcast node when its Trigger fires) then drives one incident-capture cycle:
- Buffering — the default, armed state: samples accumulate in the ring buffer and nothing
is published. Only in this state does a
FlushEventstart a cycle. - Flushing — the buffered window is published oldest first, each Record tagged with the
event's
incident_idand stamped with when it was collected, not when it was released. Withmax_flush_rate_hzleft at 0 the whole window goes out in one burst; set above 0, it is emitted at no more than that many Records per second, so a robot recovering from an incident does not also have to absorb the entire window at once. The window is consumed, so the next incident releases its own history rather than replaying this one. Samples collected while a rate-limited release is still draining are buffered, not published, and so become part of the next incident's pre-roll. - PostRoll — for
post_roll_duration_secafter the release finishes, samples are published live as they are collected, still tagged with the sameincident_id, so the aftermath of the incident is captured too. It runs from the end of the release, not from theFlushEvent, so a rate-limited release does not eat into it. Left at its default 0, this phase is skipped entirely: pre-roll only. - Cooldown — for
cooldown_secafter post-roll ends, furtherFlushEvents are ignored, so a flapping Trigger cannot produce a flood of overlapping incidents. Samples are buffered again during this phase, so the next incident still gets a full pre-roll window.
Files follow their Records. A Measurement that produces Files (camera, map, …) normally leaves
them under save_local_base_path for the Bridge to upload as soon as the Record naming them is
published — but an armed Measurement publishes nothing, so every File it produces while buffering
(also during cooldown, and while a rate-limited release is still draining) is instead moved into
a scratch directory beside the save path,
<save_local_base_path>/.dc_incident_scratch/<measurement_name>/, and the buffered Record is
rewritten to reference the staged copy. That scratch directory rolls on the same
buffer_duration_sec window as the Records themselves: a staged File is deleted from disk at the
same moment its Record ages out of the ring buffer, so an armed Measurement's Files stay bounded
instead of accumulating images no Record will ever carry to the Bridge. On release the staged
copies are handed on with the Records referencing them — remote_paths is untouched, so each File
uploads to exactly the Destination key it was collected under — and the scratch ring stops
tracking them, leaving the Bridge's usual retention sweep and delete_when_sent to clean them up.
The Bridge needs no configuration for any of this: a released Record is an ordinary Files Record
that happens to be older than usual. Files collected during PostRoll are published live and
never staged at all.
The Measurement then re-arms itself back to Buffering with no manual intervention — a
second incident is captured exactly like the first. With both post_roll_duration_sec and
cooldown_sec left at 0, a flush releases the pre-roll window and the Measurement is armed
again immediately.
incident_id is a top-level field of the Record envelope, beside tags, run_id and name
— not a key nested inside the measurement's own data — so a postgres Destination stores it
in its own incident_id column and "everything from this one event" is a plain
WHERE incident_id = '…'. See Destinations for the column
the table needs. A Record collected outside an incident carries no incident_id at all,
leaving the column NULL. A Group lifts a member's incident_id onto the merged
Record the same way it does tags, so grouping does not bury it.
gate_condition is a one-shot arming latch: it names a single
Condition plugin (any type under dc_measurements/plugins/conditions/) that suppresses
every collection — including the init_collect Record normally published on
activation — until that Condition becomes true for the first time. Once armed, the
Condition is never consulted again for the lifetime of the node, even if it later becomes
false again; re-arming does not happen. This is unlike if_all_conditions/
if_any_conditions/if_none_conditions, which are re-evaluated on every collection and can
suppress publishing again once their Conditions change. If the named Condition doesn't
exist among condition_plugins, collection is held back permanently and an error is
logged.
The three lists are evaluated on every collection and ANDed together: if_all_conditions
objects unless every Condition it names is active, if_any_conditions unless at least one
of its Conditions is active, and if_none_conditions unless every Condition it names is
inactive. A list left empty never objects, so a Measurement naming no Condition at all
always collects. A name that is not among condition_plugins reads as inactive and an
error is logged: it blocks collection when listed in if_all_conditions or
if_any_conditions, and is accepted by if_none_conditions.
Available plugins:
| Name | Description |
|---|---|
| Battery | Charge percentage, voltage and current of a pack, plus charging sessions and completed cycles |
| Camera | Camera images, images can be rotated and inspected to detect content in images. They are saved as files |
| Command velocity | Command velocity: navigation commands |
| CPU | CPU statistics |
| Diagnostics | /diagnostics DiagnosticStatus entries, converted to Records so hardware/driver health reaches Destinations |
| Distance traveled | Total distance traveled by the robot |
| Driving type | Current operating mode — autonomous, manual, teleop or unknown |
| Dummy | Dummy event, for testing and debugging |
| Fast DDS statistics | eProsima Fast DDS's own Statistics Module: latency, throughput, RTPS packets, physical-layer data. Fast-DDS-specific |
| Fault | Component diagnostic level transitions: one Record per raise, change or clear, a source for MTBF/MTTR |
| Intervention | Human takeovers: how often, how long autonomous beforehand, how long the takeover lasted |
| IP Camera | IP camera videos as files |
| Manipulation | One MoveIt MoveGroup goal's lifecycle — start and end Records with outcome and timing |
| Map | ROS map files (yaml and pgm) and metadata used by the robot to localize and navigate |
| Memory | System memory usage |
| Mission Nav2 (NavigateToPose) | Nav2 adapter of the Mission Measurement for a single-pose NavigateToPose goal |
| Mission (nav2 FollowWaypoints) | Outcome of a nav2 FollowWaypoints patrol/waypoint-following run, including per-waypoint failures |
| Mission Nav2 (NavigateThroughPoses) | Nav2 adapter of the Mission Measurement for a NavigateThroughPoses goal |
| Mission (Open-RMF) | Open-RMF adapter of the Mission Measurement, reading rmf-web's per-task TaskState |
| Network | Network interfaces, availability |
| OS | Operating System information |
| Permissions | Permissions of a file or directory |
| Position | Robot position |
| Random | A randomly generated value every polling interval — for exercising the pipeline without robot infrastructure |
| ROS2 control status | When a ros2_control controller or hardware component crosses into or out of the active state |
| Serial interface | Line-delimited data off a configurable serial port, parsed into named Record fields |
| slam_toolbox quality | Localization quality from slam_toolbox's /pose and loop-closure topics |
| Speed | Robot speed |
| Storage | Available and used space in a directory |
| String stamped | Republish a string stamped message, can be used for external data |
| TCP Health | Health status of a TCP Server |
| Thermal | Temperatures (CPU, GPU, board, …) from the kernel's thermal sysfs interface |
| Uptime | How long the machine has been turned on |
Battery
Description
Records the state of one battery pack from a sensor_msgs/BatteryState topic: charge percentage,
voltage and current on the polling interval, plus a Record when a charging session starts and
another when it ends. Charging is unavailable time, so the session boundaries are what turn
battery data into a shift-utilisation number downstream.
The Measurement emits facts, not metrics: "charging started at 14:02:11 after a discharge of 62 %", never "battery availability is 87 %". Aggregation belongs in SQL views, where the time window is a query parameter.
Every Record carries an event field naming which of the three it is:
event | When | Carries |
|---|---|---|
sample | Every polling interval, once the topic published | percentage, voltage, current, power_supply_status, completed_cycles, whatever else the pack reports |
charge_session_start | The pack starts charging | session_id, and the depth of the discharge that preceded it |
charge_session_end | The pack stops charging | session_id, duration_sec, and the percentage points gained |
Sessions are delimited by the pack's power_supply_status, never by a percentage threshold, so a
noisy percentage cannot open and close sessions repeatedly; a status of unknown carries no
information and leaves an open session open. Completed cycles are accumulated from discharge depth
rather than counted as full discharges — two half discharges are one cycle, not two — so a robot
topped up at every dock still reports the wear it actually did. That accounting lives in
dc_common::BatteryCycleAccumulator, which has no ROS dependency and is tested on its own; the
plugin subscribes, delegates and serialises.
sensor_msgs/BatteryState leaves most fields optional and signals "unmeasured" with NaN. A field
the hardware doesn't fill is left out of the Record rather than written as null, so a pack
that reports only a voltage still produces a valid Record. Until the input topic publishes at all,
no Record is emitted: a gap in the data simply means the battery hasn't reported yet.
Battery health is reported the way the hardware reports it — power_supply_health when the pack
sends one, and health_percentage (capacity against design_capacity) only when it sends both.
A robot with two packs runs one Measurement per pack, each with its own topic and
topic_output. Like every other Measurement, it can be gated by
Conditions and merged into a Group.
A session boundary is queued when it happens and leaves on the next poll, one Record per poll, so it travels the same path as every other Record (Conditions, incident buffering, Group). It keeps the timestamp of the moment it happened, not of the poll that carried it out.
Parameters
| Parameter | Description | Type | Default |
|---|---|---|---|
| topic | Topic (sensor_msgs/BatteryState) to read the pack from. One Measurement per pack | str | "/battery_state" (Optional) |
| percentage_scale | Factor applied to the message's percentage. sensor_msgs/BatteryState specifies a 0-1 range; a driver that already publishes 0-100 is configured with 1.0 | double | 100.0 (Optional) |
Schema
{
  "$schema": "http://json-schema.org/draft-07/schema#",
  "title": "Battery",
  "description": "Battery state of one pack: charge percentage, voltage and current on the polling interval, plus a Record at each charging session boundary",
  "properties": {
    "event": { "type": "string", "enum": ["sample", "charge_session_start", "charge_session_end"] },
    "power_supply_status": { "type": "string", "enum": ["unknown", "charging", "discharging", "not_charging", "full"] },
    "percentage": { "type": "number", "minimum": 0, "maximum": 100 },
    "voltage": { "type": "number" },
    "current": { "type": "number" },
    "charge": { "type": "number" },
    "capacity": { "type": "number" },
    "design_capacity": { "type": "number" },
    "health_percentage": { "type": "number", "minimum": 0 },
    "temperature": { "type": "number" },
    "present": { "type": "boolean" },
    "power_supply_health": { "type": "string" },
    "power_supply_technology": { "type": "string" },
    "location": { "type": "string" },
    "serial_number": { "type": "string" },
    "completed_cycles": { "type": "integer", "minimum": 0 },
    "session_id": { "type": "integer", "minimum": 1 },
    "duration_sec": { "type": "number", "minimum": 0 },
    "discharge_depth_percent": { "type": "number", "minimum": 0 },
    "start_percentage": { "type": "number", "minimum": 0, "maximum": 100 },
    "end_percentage": { "type": "number", "minimum": 0, "maximum": 100 },
    "charged_percent": { "type": "number" }
  },
  "required": ["event"],
  "type": "object"
}
The full file (plugins/measurements/json/battery.json) also requires power_supply_status on a
sample; session_id and discharge_depth_percent on a session start; and session_id plus
duration_sec on a session end — the fields the views depend on. Everything else is hardware
dependent and therefore optional.
Configuration
...
battery:
  plugin: "dc_measurements/Battery"
  topic_output: "/dc/measurement/battery"
  polling_interval: 10000
  topic: "/battery_state"
Two packs:
...
battery_left:
  plugin: "dc_measurements/Battery"
  topic_output: "/dc/measurement/battery_left"
  topic: "/left/battery_state"
battery_right:
  plugin: "dc_measurements/Battery"
  topic_output: "/dc/measurement/battery_right"
  topic: "/right/battery_state"
Example output
One sample:
{
  "event": "sample",
  "percentage": 62.0,
  "voltage": 48.4,
  "current": -12.5,
  "power_supply_status": "discharging",
  "power_supply_health": "good",
  "capacity": 42.0,
  "design_capacity": 50.0,
  "health_percentage": 84.0,
  "present": true,
  "completed_cycles": 3,
  "serial_number": "PACK-A"
}
A charging session, start and end:
{
  "event": "charge_session_start",
  "session_id": 4,
  "percentage": 31.0,
  "discharge_depth_percent": 62.0
}
{
  "event": "charge_session_end",
  "session_id": 4,
  "duration_sec": 3600.0,
  "start_percentage": 31.0,
  "end_percentage": 97.0,
  "charged_percent": 66.0
}
Camera
Description
Save camera image files: raw, rotated and/or inspected. Images can be inspected using different detection modules (e.g. barcode/QR detection, in-process via ZXing-C++)
Parameters
| Parameter | Description | Type | Default |
|---|---|---|---|
| cam_name | Name to give to the camera | str | N/A (mandatory) |
| cam_topic | Topic from where camera data needs to be fetched | str | N/A (mandatory) |
| camera_info_topic | Topic to read the camera intrinsics from, for pose estimation | str | camera_info next to cam_topic |
| code_size | Physical side length of the detected codes, in meters. Mandatory when estimate_pose is true | double | 0.0 |
| detection_modules | Detection modules to use | list[str](barcode) | N/A (optional) |
| draw_det_barcodes | Draw barcode detection on images | bool | true |
| estimate_pose | Estimate the pose of each detected code and add it to the Record | bool | false |
| pose_frame | Frame to transform the estimated pose into. Empty means the camera optical frame | str | "" |
| rotation_angle | Rotate the image before inspecting it by this angle | int (90, 180, 270) | 0 |
| transform_timeout | How long to wait for the pose_frame transform, in seconds | double | 0.1 |
| save_detections_img | Whether to save inspected image captured by the camera with detection shapes | bool | true |
| save_inspected_base64 | Whether to save inspected image captured by the camera with detection shapes as base64 string | bool | false |
| save_inspected_path | Path to save the inspected camera image. Expands environment variables and datetime format are expanded | str | "camera/inspected/%Y-%m-%dT%H:%M:%S" |
| save_raw_base64 | Whether to save raw image captured by the camera as base64 string | bool | false |
| save_raw_img | Whether to save raw image captured by the camera | bool | false |
| save_raw_path | Path to save the raw camera image. Expands environment variables and datetime | str | "camera/raw/%Y-%m-%dT%H:%M:%S" |
| save_rotated_base64 | Whether to save rotated image captured by the camera as base64 string | bool | false |
| save_rotated_img | Whether to save rotated image captured by the camera | bool | false |
| save_rotated_path | Path to save the rotated camera image. Expands environment variables and datetime format are expanded | str | "camera/rotated/%Y-%m-%dT%H:%M:%S" |
Code pose estimation
With estimate_pose: true, every detected code carries a pose alongside its bounding box.
The pose is solved from the code's four detected corners with
cv::solvePnP (SOLVEPNP_IPPE_SQUARE,
the solver for four coplanar corners of a square), which needs two things detection alone does
not: the code's physical side length (code_size, in meters) and the camera intrinsics, read
from camera_info_topic. It is off by default and costs nothing when off — no camera_info
subscription is created and Records are unchanged.
Frame and convention
The pose is the code's pose, not the robot's — where the code is as seen from the robot.
By default it is expressed in the camera optical frame (the frame_id of the camera_info
message, following REP 103: X right, Y down, Z forward
along the lens axis), so z is the depth of the code in front of the camera. The code's own
frame is centered on the code and uses those same axes — X right, Y down, Z into its printed
face — so a code seen square-on has the identity orientation, and roll/pitch/yaw read
as how far off square-on it was. (This is the ArUco/OpenCV marker frame turned 180° about X:
that convention puts Z out of the face towards the camera, which would make a square-on read a
180° roll.)
Set pose_frame to have the pose transformed into a robot frame (base_link, map, …) via TF
before it is written. Every Record says which frame it is in: the emitted pose.frame_id is the
frame actually used, so if the transform is unavailable within transform_timeout the pose is
still reported — in the camera optical frame, with a warning logged, rather than dropped.
pose.distance is the camera-to-code range in meters and is unaffected by pose_frame.
rotation_angle is handled: the corners are mapped back to raw-image coordinates before the
solve, so the intrinsics still describe the image they were calibrated on.
camera:
  plugin: "dc_measurements/Camera"
  cam_topic: "/front_camera/image_raw"
  # camera_info_topic defaults to /front_camera/camera_info, next to cam_topic
  cam_name: my_camera_with_codes
  detection_modules: ["barcode"]
  estimate_pose: true
  code_size: 0.2       # meters, side length of the printed code
  pose_frame: "base_link"
  transform_timeout: 0.1
{
  "camera_name": "my_camera_with_codes",
  "inspected": {
    "barcode": [
      {
        "data": "0001", "type": "QRCode",
        "top": 210, "left": 295, "width": 84, "height": 84,
        "pose": {
          "frame_id": "base_link",
          "x": 1.482, "y": 0.037, "z": 0.611,
          "roll": 0.0, "pitch": 0.0, "yaw": 3.139,
          "distance": 1.483
        }
      }
    ]
  }
}
The scale of the estimate comes entirely from code_size: a code declared 20 cm wide that is
really 10 cm reports every distance twice as far as it is. Likewise the intrinsics are taken as
published — if camera_info carries an uncalibrated or placeholder camera matrix, the pose is
wrong without being flagged. Codes seen nearly edge-on or only a few pixels wide are also
poorly conditioned; use pose.distance to filter those out downstream.
Two systematic biases are worth knowing about before treating a pose as a measurement rather than a hint:
- Corner convention. A detector locates the code to within about one module, so range carries a bias of roughly one module width — a few percent for a low-version QR code. This is a bias, not noise: averaging repeated reads does not remove it.
- Non-square codes.
SOLVEPNP_IPPE_SQUAREassumes the four corners bound a square. A stretched or rectangular code is solved to a compromise scale.dc_simulation's ownqrcode_*assets are exactly this case — a 290x365 texture over a 0.5 x 0.5 m face makes the printed code 0.362 m across and 0.292 m down — which is why the demo setscode_sizeto a mid-value of 0.325 and why the simulation check tolerates a metre of error rather than centimetres.
Schema
{
  "$schema": "http://json-schema.org/draft-07/schema#",
  "title": "Camera",
  "description": "Camera images with detected objects",
  "properties": {
    "camera_name": {
      "description": "Name of the camera",
      "type": "string"
    },
    "local_paths": {
      "description": "Paths of saved images",
      "type": "object",
      "items": {
        "$ref": "#/$defs/paths"
      }
    },
    "remote_paths": {
      "description": "Dictionary of paths where metadata and images will be remotely stored",
      "type": "object",
      "additionalProperties": {
        "type": "object",
        "items": {
          "$ref": "#/$defs/paths"
        }
      }
    },
    "inspected": {
      "description": "Inspected content of an image",
      "type": "object",
      "items": {
        "$ref": "#/$defs/inspected"
      }
    }
  },
  "$defs": {
    "paths": {
      "type": "object",
      "properties": {
        "raw": {
          "description": "Raw image",
          "type": "string"
        },
        "rotated": {
          "description": "Rotated image",
          "type": "string"
        },
        "inspected": {
          "description": "Inspected image",
          "type": "string"
        }
      }
    },
    "inspected": {
      "type": "object",
      "properties": {
        "barcode": {
          "description": "Barcode inspected data",
          "type": "array",
          "items": {
            "$ref": "#/$defs/barcode"
          }
        }
      }
    },
    "barcode": {
      "type": "object",
      "properties": {
        "data": {
          "description": "Barcode data",
          "type": "string"
        },
        "height": {
          "description": "Barcode height",
          "type": "integer"
        },
        "width": {
          "description": "Barcode width",
          "type": "integer"
        },
        "top": {
          "description": "Barcode top position",
          "type": "integer"
        },
        "left": {
          "description": "Barcode left position",
          "type": "integer"
        },
        "type": {
          "description": "Barcode type",
          "type": "string"
        },
        "pose": {
          "description": "Pose of the code, present only when estimate_pose is enabled",
          "$ref": "#/$defs/pose"
        }
      }
    },
    "pose": {
      "type": "object",
      "properties": {
        "frame_id": {
          "description": "Frame the pose is expressed in",
          "type": "string"
        },
        "x": {
          "description": "Code position along the frame's X axis, in meters",
          "type": "number"
        },
        "y": {
          "description": "Code position along the frame's Y axis, in meters",
          "type": "number"
        },
        "z": {
          "description": "Code position along the frame's Z axis, in meters",
          "type": "number"
        },
        "roll": {
          "description": "Code orientation about the frame's X axis, in radians",
          "type": "number"
        },
        "pitch": {
          "description": "Code orientation about the frame's Y axis, in radians",
          "type": "number"
        },
        "yaw": {
          "description": "Code orientation about the frame's Z axis, in radians",
          "type": "number"
        },
        "distance": {
          "description": "Straight-line distance from the camera to the code, in meters",
          "type": "number"
        }
      }
    }
  },
  "type": "object"
}
Configuration
The remote paths are also saved in the JSON under <measurement_name>.
Note that this remote key is not included in the JSON schema, which only contains the local paths. If you want to enforce the schema with your custom remote key, you will need to write it and load it manually.
...
camera:
  plugin: "dc_measurements/Camera"
  group_key: "camera_with_codes"
  topic_output: "/dc/measurement/camera_with_codes"
  polling_interval: 10000
  init_collect: true
  node_name: "dc_measurement_camera"
  cam_topic: "/camera_with_codes"
  cam_name: my_camera_with_codes
  enable_validator: false
  draw_det_barcodes: true
  save_raw_img: true
  save_rotated_img: false
  save_detections_img: true
  save_raw_path: "camera_with_codes/raw/%Y-%m-%dT%H-%M-%S"
  save_rotated_path: "camera_with_codes/rotated/%Y-%m-%dT%H-%M-%S"
  save_inspected_path: "camera_with_codes/inspected/%Y-%m-%dT%H-%M-%S"
  rotation_angle: 0
  detection_modules: ["barcode"]
  remote_prefixes: [""]
  remote_keys: ["rustfs"] # Will create paths for RustFS, does not send the file
Destination (dc_bridge) configuration
Now that the path is set, it can be used to know where to send the image. The
Destination name (rustfs) must match the remote_keys entry above — the Uploader
matches a Record's remote_paths keys against receives: files Destination names (see
Destinations):
dc_bridge:
  ros__parameters:
    destinations: ["rustfs", "pgsql"]
    rustfs:
      type: s3
      receives: files
      inputs: ["/dc/group/cameras"]
      endpoint: "http://127.0.0.1:9000"
      access_key_id: "XEYqG4ZcPY5jiq5i"
      secret_access_key: "ji011KCtI82ZeQS6UwsQAg8x9VR4lSaQ"
      force_path_style: true
      bucket: "mybucket"
    files:
      metadata_destination: "pgsql"  # a receives: records Destination for status rows
Example output
With estimate_pose: true (same sample as Code pose estimation above):
{
  "camera_name": "my_camera_with_codes",
  "inspected": {
    "barcode": [
      {
        "data": "0001", "type": "QRCode",
        "top": 210, "left": 295, "width": 84, "height": 84,
        "pose": {
          "frame_id": "base_link",
          "x": 1.482, "y": 0.037, "z": 0.611,
          "roll": 0.0, "pitch": 0.0, "yaw": 3.139,
          "distance": 1.483
        }
      }
    ]
  }
}
A plain capture with estimate_pose: false (no pose field, otherwise identical shape) has not
been added yet.
Cmd_vel
Description
Collect command velocity sent to the robot by subscribing to cmd_vel topic.
Parameters
| Parameter | Description | Type | Default |
|---|---|---|---|
| topic | Topic to subscribe to to get the cmd_vel (geometry_msgs/Twist) | str | "/cmd_vel" |
Schema
{
    "$schema": "http://json-schema.org/draft-07/schema#",
    "title": "Cmd_vel",
    "description": "Command velocity sent to the robot",
    "properties": {
        "computed": {
            "description": "Computed command velocity in meter/s",
            "type": "number"
        },
        "linear": {
            "description": "Linear velocity as a vector",
            "type": "object",
            "items": {
                "$ref": "#/$defs/vector3"
            }
        },
        "angular": {
            "description": "Angular velocity as a vector",
            "type": "object",
            "items": {
                "$ref": "#/$defs/vector3"
            }
        }
    },
    "$defs": {
        "vector3": {
            "type": "object",
            "properties": {
                "x": {
                    "description": "X speed",
                    "type": "number"
                },
                "y": {
                    "description": "Y speed",
                    "type": "number"
                },
                "z": {
                    "description": "Z speed",
                    "type": "number"
                }
            }
        }
    },
    "type": "object"
}
Configuration
...
cmd_vel:
  plugin: "dc_measurements/CmdVel"
  group_key: "cmd_vel"
  topic_output: "/dc/measurement/cmd_vel"
Example output
{
  "angular": {
    "x": 0.0,
    "y": 0.0,
    "z": 0.1
  },
  "computed": 0.3,
  "flattened": false,
  "linear": {
    "x": 0.3,
    "y": 0.0,
    "z": 0.0
  },
  "name": "cmd_vel",
  "nested": false,
  "run_id": "169"
}
CPU
Description
Collect cpu usage: average cpu, number of processes running and processes sorted by cpu usage.
Parameters
| Parameter | Description | Type | Default |
|---|---|---|---|
| cpu_min | Filters out processes using less than this cpu usage. -1 to disable | float | 5.0 |
| max_processes | Max amount of processes to collect in the sorted field. -1 for all | int | 5 |
Schema
{
    "$schema": "http://json-schema.org/draft-07/schema#",
    "title": "Cpu",
    "description": "CPU statistics",
    "properties": {
        "average": {
            "description": "Average CPU",
            "type": "number",
            "minimum": 0
        },
        "processes": {
            "description": "Number of processes running",
            "type": "integer",
            "minimum": 0
        },
        "sorted": {
            "description": "Processes sorted by CPU usage",
            "type": "array",
            "items": {
                "$ref": "#/$defs/process"
            }
        }
    },
    "$defs": {
        "process": {
            "type": "object",
            "description": "Process information",
            "properties": {
                "pid": {
                    "description": "Process ID of the process",
                    "type": "integer"
                },
                "user": {
                    "description": "User who started the process",
                    "type": "string"
                },
                "cmd": {
                    "description": "Command that launched the process",
                    "type": "string"
                },
                "cpu": {
                    "description": "Process' current utilization as a percentage of total CPU time",
                    "type": "number"
                },
                "ram": {
                    "description": "Memory in use by this process in kb",
                    "type": "integer"
                },
                "uptime": {
                    "description": "Age of the process in seconds",
                    "type": "integer"
                }
            }
        }
    },
    "type": "object"
}
Configuration
...
cpu:
  plugin: "dc_measurements/Cpu"
  topic_output: "/dc/measurement/cpu"
  max_processes: 10
  cpu_min: 10.0
Example output
{
  "average": 20.487500071525574,
  "flattened": false,
  "name": "cpu",
  "nested": false,
  "processes": 8,
  "run_id": "169",
  "sorted": []
}
sorted is empty here because no process crossed cpu_min (10%) in this poll window.
Diagnostics
Description
Subscribes to /diagnostics (diagnostic_msgs/DiagnosticArray) and converts matching
DiagnosticStatus entries into a Record, so hardware/driver health reaches Destinations and
dashboards like any other Measurement. Each DiagnosticStatus.values key/value pair is preserved
as-is in the Record rather than being flattened into the message string.
/diagnostics is typically high-volume and mostly unchanging, so level_threshold and names
are provided to shrink what gets collected. Pair this Measurement with the same_as_previous
condition (if_none_conditions) to also skip republishing when nothing has changed since the
previous collection.
Parameters
| Parameter | Description | Type | Default |
|---|---|---|---|
| topic | Topic to subscribe to for diagnostics | str | "/diagnostics" (Optional) |
| level_threshold | Minimum status level to collect: "OK", "WARN", "ERROR", or "STALE" | str | "OK" (Optional) |
| names | Allowlist of DiagnosticStatus.name values to collect; empty collects all | list[str] | [] (Optional) |
Schema
{
  "$schema": "http://json-schema.org/draft-07/schema#",
  "title": "Diagnostics",
  "description": "Diagnostic statuses collected from /diagnostics",
  "properties": {
    "statuses": {
      "description": "Diagnostic statuses matching the configured level threshold and name allowlist",
      "type": "array",
      "items": {
        "title": "DiagnosticStatus",
        "description": "A single diagnostic_msgs/DiagnosticStatus entry",
        "properties": {
          "name": {
            "description": "Reporting component name",
            "type": "string"
          },
          "message": {
            "description": "Human-readable status summary",
            "type": "string"
          },
          "hardware_id": {
            "description": "Hardware identifier",
            "type": "string"
          },
          "level": {
            "description": "Status level: 0=OK, 1=WARN, 2=ERROR, 3=STALE",
            "type": "integer",
            "minimum": 0,
            "maximum": 3
          },
          "values": {
            "description": "Key/value pairs reported by the status, preserved as-is",
            "type": "object"
          }
        },
        "required": ["name", "message", "level", "values"],
        "type": "object"
      }
    }
  },
  "required": ["statuses"],
  "type": "object"
}
Configuration
...
diagnostics:
  plugin: "dc_measurements/Diagnostics"
  topic_output: "/dc/measurement/diagnostics"
  level_threshold: "WARN"
  names: ["motor_driver", "battery"]
  if_none_conditions: ["diagnostics_unchanged"]

diagnostics_unchanged:
  plugin: "dc_conditions/SameAsPrevious"
  keys: []
  exclude: []
Example output
{
  "flattened": false,
  "name": "diagnostics",
  "nested": false,
  "run_id": "169",
  "statuses": [
    {
      "hardware_id": "motor_driver_01",
      "level": 2,
      "message": "Overcurrent detected",
      "name": "motor_driver",
      "values": {
        "current_amps": "8.4"
      }
    }
  ]
}
Dummy
Description
The dummy measurement, generates dummy events. It is useful for testing, debugging, benchmarking and getting started with ROS 2 Data collection.
Parameters
| Parameter | Description | Type | Default |
|---|---|---|---|
| record | Dummy JSON record. | str | "{"message":"Hello from ROS 2 DC"}" |
Schema
{
    "$schema": "http://json-schema.org/draft-07/schema#",
    "title": "Dummy",
    "description": "Dummy JSON",
    "properties": {
        "message": {
            "description": "Dummy message",
            "type": "string"
        }
    },
    "type": "object"
}
Configuration
...
dummy:
  plugin: "dc_measurements/Dummy"
  topic_output: "/dc/measurement/dummy"
Example output
{
  "flattened": false,
  "message": "Hello from ROS 2 DC",
  "name": "dummy",
  "nested": false,
  "run_id": "169"
}
Distance traveled
Description
Reports the straight-line distance moved between the robot's current TF pose
(robot_base_frame in global_frame) and its pose at the previous poll — a per-poll
delta, despite the field's name. Sum it downstream (e.g. SUM(distance_traveled)
in a SQL view) to get a cumulative total since power-on.
collect() computes sqrt((x - last_x)^2 + (y - last_y)^2) against the position recorded
on the previous poll and overwrites last_x_/last_y_ with the current one — it never
accumulates into a sum. A stationary robot reports 0.0 every poll; a robot that moved 3 m
since the last poll reports 3.0 once, then 0.0 again once it stops. The Measurement's own
name and its schema's "description": "Total distance traveled in meters" both suggest a
running total, but that's misleading given what the code actually does. This is a known
issue, still unfixed and unrenamed.
Parameters
| Parameter | Description | Type | Default |
|---|---|---|---|
| global_frame | Global frame | str | "map" |
| robot_base_frame | Robot base frame | str | "base_link" |
| transform_timeout | TF Timeout to use for transformation | float | 0.1 |
onConfigure() declares a transform_tolerance parameter (default 0.1) but then reads back
transform_timeout — a name that was never declared — into the member this Measurement actually
uses. rclcpp's get_parameter(name, out) silently no-ops on an undeclared name rather than
throwing, so neither key you might set in YAML reaches the TF lookup: transform_tolerance is
declared but never read, and transform_timeout is read but never declared. The member is left
uninitialized (float transform_timeout_;, no default), so the TF-lookup timeout actually used at
runtime is whatever that memory happened to contain, not the 0.1 shown above. Known, tracked in
dc_measurements/plugins/measurements/distance_traveled.cpp, not yet fixed.
Schema
{
    "$schema": "http://json-schema.org/draft-07/schema#",
    "title": "Distance traveled",
    "description": "Total distance traveled in meters by the robot",
    "properties": {
        "distance_traveled": {
            "description": "Total distance traveled in meters",
            "type": "number"
        }
    },
    "type": "object"
}
Configuration
...
distance_traveled:
  plugin: "dc_measurements/DistanceTraveled"
  topic_output: "/dc/measurement/distance_traveled"
  global_frame: "map"
  robot_base_frame: "base_link"
  transform_timeout: 0.1
Example output
The poll during which the robot's TF pose moved 3 m since the previous poll:
{
  "distance_traveled": 3.0,
  "flattened": false,
  "name": "distance_traveled",
  "nested": false,
  "run_id": "169"
}
The next poll, stationary:
{
  "distance_traveled": 0.0,
  "flattened": false,
  "name": "distance_traveled",
  "nested": false,
  "run_id": "169"
}
Driving type
Description
Reports the robot's current operating mode (autonomous, manual, teleop, or unknown) as a
single Record, so every other Measurement can be segmented by driving mode downstream. There is no
standard ROS message for "current driving mode", so this Measurement is entirely configuration
driven and supports two common shapes, chosen by which parameters are set (configuring both is a
configuration error):
- Dedicated mode topic: subscribes to
mode_topic(std_msgs/String) and maps each raw value it carries to a mode throughvalue_mapping_from/value_mapping_to. A raw value with no entry in the mapping is ignored (the previous mode is kept) rather than treated asunknown, since an unrecognized value is more likely an upstream hiccup than an actual mode change. - Velocity source inference: subscribes to
velocity_topics(geometry_msgs/Twist, e.g. one topic per command source such as a Nav2 output and a joystick teleop node) and reports the mode of whichever configured source last published, mapped through the parallelvelocity_modeslist. A source that hasn't published withinvelocity_timeout_sis no longer considered active.
The emitted mode is always one of the four values above -- a documented, closed set -- so
downstream grouping/dashboards never see an unbounded string. Before any mode has been observed
(no Measurement configured, a dedicated mode topic that hasn't published yet, or every velocity
source past its timeout) the Measurement reports "unknown" rather than skipping the Record: a
Record is always published on every poll, so a gap in driving_type data means the plugin itself
stopped, not "mode currently unknown".
Parameters
| Parameter | Description | Type | Default |
|---|---|---|---|
| mode_topic | Topic (std_msgs/String) carrying a raw mode value, mapped through value_mapping_from/value_mapping_to. Mutually exclusive with velocity_topics | str | "" (Optional) |
| value_mapping_from | Raw values received on mode_topic, aligned by index with value_mapping_to | list of str | [] (Optional) |
| value_mapping_to | Mode each value_mapping_from entry maps to; must be one of autonomous, manual, teleop, unknown | list of str | [] (Optional) |
| velocity_topics | Velocity command topics (geometry_msgs/Twist) to infer the mode from, aligned by index with velocity_modes. Mutually exclusive with mode_topic | list of str | [] (Optional) |
| velocity_modes | Mode each velocity_topics entry reports while it's the most recently active source | list of str | [] (Optional) |
| velocity_timeout_s | Seconds since a velocity source's last message before it's no longer considered active | double | 1.0 (Optional) |
Schema
{
  "$schema": "http://json-schema.org/draft-07/schema#",
  "title": "DrivingType",
  "description": "Current driving/operating mode of the robot, so every other metric can be segmented by mode",
  "properties": {
    "mode": {
      "description": "Driving mode: 'unknown' until a mode has been observed (dedicated mode topic) or a configured velocity source has published within 'velocity_timeout_s' (velocity-source inference)",
      "type": "string",
      "enum": ["autonomous", "manual", "teleop", "unknown"]
    }
  },
  "required": ["mode"],
  "type": "object"
}
Configuration
Dedicated mode topic:
...
driving_type:
  plugin: "dc_measurements/DrivingType"
  topic_output: "/dc/measurement/driving_type"
  mode_topic: "/driving_mode_raw"
  value_mapping_from: ["0", "1", "2"]
  value_mapping_to: ["manual", "autonomous", "teleop"]
Velocity source inference:
...
driving_type:
  plugin: "dc_measurements/DrivingType"
  topic_output: "/dc/measurement/driving_type"
  velocity_topics: ["/nav2/cmd_vel", "/teleop/cmd_vel"]
  velocity_modes: ["autonomous", "teleop"]
  velocity_timeout_s: 1.0
Example output
{
  "mode": "autonomous"
}
Fast DDS statistics
This Measurement links against eProsima's Fast-DDS-statistics-backend C++ library and reads
data Fast DDS's own Statistics Module produces. It only means anything when the deployment runs
Fast DDS as its RMW — Cyclone DDS and other RMW implementations have no equivalent library to
read from (checked: cyclonedds-insight, eProsima's own recently-announced tool, is GUI-only with
no headless export path). It builds conditionally: dc_measurements/CMakeLists.txt looks for
fastdds_statistics_backend and skips building this plugin — with a clear message(STATUS ...),
not a failed workspace build — when it isn't found. Configuring
fastdds_stats: {plugin: "dc_measurements/FastddsStats"} without the library built fails
pluginlib's load loudly (missing library), rather than silently doing nothing.
Description
Reads eProsima Fast DDS's own Statistics Module — latency, throughput and RTPS packet counts
between the DomainParticipants, DataWriters and DataReaders it discovers on a DDS domain — through
Fast-DDS-statistics-backend, and emits one sample Record per polling interval. It follows the
same periodic-sample convention as Battery's sample event and
Uptime: everything reported is scoped to the window since the previous poll,
reset each time rather than accumulated since the Measurement started.
Unlike every other Measurement, fastdds_stats has no input topic: it starts a
StatisticsBackend monitor on a DDS domain at onConfigure() and queries that domain's own
statistics registry directly on each poll, rather than subscribing to anything. A robot's whole DDS
graph (every node's participants, on whatever domain it runs) is visible to one Measurement
instance, so normally one fastdds_stats Measurement per robot is enough.
Each sample reports:
- Discovered entity counts (
participant_count,datawriter_count,datareader_count) - Mean write-to-notification latency across every matched DataWriter/DataReader pair
(
latency_ns_mean, nanoseconds — Fast DDS's own unit for this statistic) - Mean data rate sent and received (
publication_throughput_bytes_per_sec_mean,subscription_throughput_bytes_per_sec_mean, bytes/second) - RTPS packets sent and lost, summed across every participant (
rtps_packets_sent,rtps_packets_lost) - Physical-layer data: each discovered participant's
name/guid, and the names of the hosts, OS users and processes running them (hosts,users,process_names— notprocesses, which the CPU Measurement's total process count already owns in the shareddctable) — useful for spotting which machine or process is actually behind a noisy participant on a multi-process robot
A field tied to a DataKind (latency, throughput, packet counts) is absent when nothing
reported data in the window — a domain with one lonely participant and no matched
DataWriter/DataReader pair yet still produces a valid Record, just without a latency_ns_mean.
onConfigure() calls StatisticsBackend::init_monitor(domain_id) once, which is what makes Fast
DDS's Statistics Module start reporting for that domain at all — nothing is collected on a domain
no Measurement has called init_monitor() for. onCleanup() calls stop_monitor() to tear it back
down on a lifecycle transition.
Prerequisites
-
Fast DDS itself built with
-DFASTDDS_STATISTICS=ON— the Statistics Module is compiled out by default, and most distro/apt Fast DDS builds do not enable it. ROS 2 Rolling pairs with Fast-DDS 3.x — rebuild the Fast-DDS set upstream'sros2.repospins for this distro in a colcon workspace overlay with that cmake arg, then source the overlay before the rest of the workspace so it shadows the apt-installed Fast DDS. -
fastdds_statistics_backendbuilt and installed against that same Fast-DDS. Pin av2.xtag — that line is what targets Fast-DDS 3.0.0 (find_package(fastdds 3.0.0 REQUIRED)), which is what Rolling ships; the olderv1.0.0/v1.1.0releases target Fast-DDS>=2.13.0and won't build against it. No rosdep/apt key exists for any distro, sorosdep installnever pulls it in anddc_measurements/package.xmldeliberately does not list it as a<depend>. -
The
FASTDDS_STATISTICSenvironment variable, set on every process before it creates its first DomainParticipant — the library only emits the DataKinds named in it (semicolon- separated topic aliases), regardless of whether the plugin is built and running:export FASTDDS_STATISTICS="HISTORY_LATENCY_TOPIC;PUBLICATION_THROUGHPUT_TOPIC;SUBSCRIPTION_THROUGHPUT_TOPIC;RTPS_SENT_TOPIC;RTPS_LOST_TOPIC"Without it,
participant_count/datawriter_count/datareader_count/participants/hosts/users/process_namesstill populate (basic discovery data), butlatency_ns_meanand every throughput/RTPS-packet field stay permanently absent — not intermittently, every single poll.
Without #1/#2, find_package(fastdds_statistics_backend) fails at CMake configure time and the
plugin — and its test — are skipped from the build entirely.
Parameters
| Parameter | Description | Type | Default |
|---|---|---|---|
| domain_id | DDS domain to monitor (the same value ROS_DOMAIN_ID would use) | int | 0 (Optional) |
Schema
{
  "$schema": "http://json-schema.org/draft-07/schema#",
  "title": "FastddsStats",
  "properties": {
    "event": { "type": "string", "enum": ["sample"] },
    "domain_id": { "type": "integer", "minimum": 0 },
    "participant_count": { "type": "integer", "minimum": 0 },
    "datawriter_count": { "type": "integer", "minimum": 0 },
    "datareader_count": { "type": "integer", "minimum": 0 },
    "latency_ns_mean": { "type": "number", "minimum": 0 },
    "publication_throughput_bytes_per_sec_mean": { "type": "number", "minimum": 0 },
    "subscription_throughput_bytes_per_sec_mean": { "type": "number", "minimum": 0 },
    "rtps_packets_sent": { "type": "integer", "minimum": 0 },
    "rtps_packets_lost": { "type": "integer", "minimum": 0 },
    "participants": { "type": "array" },
    "hosts": { "type": "array", "items": { "type": "string" } },
    "users": { "type": "array", "items": { "type": "string" } },
    "process_names": { "type": "array", "items": { "type": "string" } }
  },
  "required": ["event", "domain_id", "participant_count", "datawriter_count", "datareader_count"],
  "type": "object"
}
The full file (plugins/measurements/json/fastdds_stats.json) also spells out each
participants[] entry's name/guid properties.
Configuration
...
fastdds_stats:
  plugin: "dc_measurements/FastddsStats"
  topic_output: "/dc/measurement/fastdds_stats"
  polling_interval: 5000
  domain_id: 0
Example output
Captured from a real run (all three prerequisites above met):
{
  "custom_keys": ["robot_name"],
  "datareader_count": 1,
  "datawriter_count": 11,
  "domain_id": 0,
  "event": "sample",
  "flattened": false,
  "hosts": ["d:14058711922191368192"],
  "name": "fastdds_stats",
  "nested": false,
  "participant_count": 3,
  "participants": [
    { "guid": "01.0f.4d.26.9c.1d.72.46.00.00.00.00|0.0.1.c1", "name": "/" },
    { "guid": "01.0f.4d.26.13.27.ae.cb.00.00.00.00|0.0.1.c1", "name": "/" },
    { "guid": "01.0f.4d.26.25.27.c4.fd.00.00.00.00|0.0.1.c1", "name": "/" }
  ],
  "process_names": ["7580", "10003", "10021"],
  "robot_name": "C3PO",
  "run_id": "172",
  "users": ["root"]
}
latency_ns_mean and every throughput/RTPS field are absent here: nothing exchanged data
on a matched DataWriter/DataReader pair within this particular 5-second poll window, and
per the Statistics Backend's own contract, absence is how "nothing to report" is signaled.
A busier DDS graph (more topics, higher rate) makes them appear more often, though never
guaranteed on every poll.
<footer id="open-on-gh">Found a bug? <a href="https://github.com/minipada/ros2_data_collection/edit/main/doc/src/dc/measurements/fastdds_stats.md">Edit this page on GitHub.</a></footer>Fault
Description
Reports the transitions diagnostics's periodic snapshots leave a consumer to reconstruct:
diagnostics writes the current DiagnosticStatus level on every poll, so recovering "when did
this component break, and when was it fixed" means scanning for where a value changed in
SQL -- exactly the failure mode transition Records exist to prevent. Fault subscribes to the same
/diagnostics topic (diagnostic_msgs/DiagnosticArray) and emits one Record per component only
when its level actually changes, feeding each watched component's stream of (level, timestamp)
samples to its own dc_common::StateTransitionDetector, a header-only dc_common type generic
over the state being tracked and owning no clock of its own.
Every Record carries the component, the level it left (from_level) and entered (to_level), how
long the previous level had been held (previous_level_duration_s), and the status message as the
reason. Levels are the DiagnosticStatus constants OK, WARN, ERROR and STALE -- reported
by name, so a silent (STALE) component is never confused with a broken (ERROR) one.
Each transition is also classified as an event:
- raise -- the component left
OK. A new fault opens ("state": "open"), andfault_started_atrecords when. - change -- a transition between two non-
OKlevels (e.g.WARNtoERROR). The fault stays open;fault_started_atis unchanged from the raise that opened it. - clear -- the component returned to
OK. The fault closes ("state": "closed") and the Record carriesduration_s, the length of the whole fault, alongside the samefault_started_atthe raise carried -- so the pair can be joined downstream for MTTR. MTBF is the gap between successiveraiseevents for a component.
A fault still open when collection stops keeps its last Record's "state": "open" and no
duration_s: no closing Record is invented, so it cannot be read as a zero-length outage. Every
Record carries a seq that increments by one across every watched component, so a dropped Record
is a detectable gap rather than a silently shortened outage. A component observed already faulted
on its very first sample has no fault_started_at on that Record -- the detector treats the first
sample as a baseline rather than a transition, since it never saw the fault actually start.
Parameters
| Parameter | Description | Type | Default |
|---|---|---|---|
| topic | Topic to subscribe to for diagnostics | str | "/diagnostics" (Optional) |
| names | Which DiagnosticStatus.name values to watch; empty watches every component seen | list[str] | [] (Optional) |
Schema
{
  "$schema": "http://json-schema.org/draft-07/schema#",
  "title": "Fault",
  "properties": {
    "seq": { "type": "integer", "minimum": 1 },
    "component": { "type": "string" },
    "event": { "type": "string", "enum": ["raise", "clear", "change"] },
    "from_level": { "type": "string", "enum": ["OK", "WARN", "ERROR", "STALE"] },
    "to_level": { "type": "string", "enum": ["OK", "WARN", "ERROR", "STALE"] },
    "previous_level_duration_s": { "type": "number", "minimum": 0 },
    "reason": { "type": "string" },
    "state": { "type": "string", "enum": ["open", "closed"] },
    "fault_started_at": { "type": "string" },
    "duration_s": { "type": "number", "minimum": 0 }
  },
  "required": ["seq", "component", "event", "from_level", "to_level", "previous_level_duration_s", "reason", "state"],
  "type": "object"
}
Configuration
...
fault:
  plugin: "dc_measurements/Fault"
  topic_output: "/dc/measurement/fault"
  group_key: "fault"
  topic: "/diagnostics"
  names: ["motor_driver", "battery"]
Example output
A raise:
{
  "seq": 1,
  "component": "motor_driver",
  "event": "raise",
  "from_level": "OK",
  "to_level": "ERROR",
  "previous_level_duration_s": 3612.4,
  "reason": "Motor fault",
  "state": "open",
  "fault_started_at": "2026-08-18T09:12:33.123456Z"
}
and its clear:
{
  "seq": 2,
  "component": "motor_driver",
  "event": "clear",
  "from_level": "ERROR",
  "to_level": "OK",
  "previous_level_duration_s": 214.9,
  "reason": "Motor nominal",
  "state": "closed",
  "fault_started_at": "2026-08-18T09:12:33.123456Z",
  "duration_s": 214.9
}
Intervention
Description
Reports human takeovers: how often somebody had to step in, how long the robot had been running
itself beforehand, and how long the takeover lasted. It is a projection of driving-mode
transitions -- it reads the same mode signal
Driving type reads (the shared DrivingModeSource, so both Measurements are
configured with the same parameters) and hands it to dc_common::StateTransitionDetector (#360),
rather than running its own separate detection. The two therefore cannot disagree about when the
robot was autonomous.
A takeover is a transition between autonomous and one of the two human-driven modes, manual or
teleop -- this set is fixed and has no configuration knob, because dc_kpi_intervention_events
(tools/infrastructure/sql/kpi_views.sql, #369) already matches these values literally; a custom
mode name would silently never count downstream.
Two Records per takeover:
- a start Record, when the mode leaves
autonomousformanualorteleop.openistrue. - an end Record, when the mode returns to
autonomous.openisfalse.
Both carry from_mode, to_mode, and previous_duration: the dwell of from_mode, in seconds.
On a start Record that is how long the robot had been autonomous before the takeover; on an end
Record it is exactly how long the takeover itself lasted, because from_mode is the mode that just
ended either way. sequence is the transition's own monotonically increasing number (from
StateTransitionDetector), so a dropped Record shows up as a gap rather than silently corrupting a
duration.
A takeover still open when collection stops simply never gets a matching end Record: nothing
downstream can average an interval that was never closed as a zero, because there is no end
Record to average. Nothing is published on a poll that saw no takeover boundary, so unlike
driving_type this Measurement is silent most of the time. A transition that is not a boundary --
autonomy handing over to unknown because the mode signal went stale, or one human mode replacing
another directly -- produces no Record.
Rates (interventions per autonomous hour, per kilometre travelled) are deliberately not
computed here: they are views over these Records (dc_kpi_intervention_rate), so the denominator
can change without touching a robot. Set group_key to merge an intervention with position in a
Group and put the takeover on the site map.
Parameters
The mode-source parameters are the same ones Driving type takes, with the
same meaning: mode_topic, value_mapping_from, value_mapping_to, velocity_topics,
velocity_modes, velocity_timeout_s. Configuring both mode_topic and velocity_topics is a
configuration error.
Schema
{
  "$schema": "http://json-schema.org/draft-07/schema#",
  "title": "Intervention",
  "description": "A human takeover, derived from driving-mode transitions: one Record when it starts, one when it ends",
  "properties": {
    "event": { "type": "string", "enum": ["start", "end"] },
    "from_mode": { "type": "string", "enum": ["autonomous", "manual", "teleop", "unknown"] },
    "to_mode": { "type": "string", "enum": ["autonomous", "manual", "teleop", "unknown"] },
    "previous_duration": { "type": "number", "minimum": 0 },
    "sequence": { "type": "integer", "minimum": 1 },
    "open": { "type": "boolean" }
  },
  "required": ["event", "from_mode", "to_mode", "previous_duration", "sequence", "open"],
  "type": "object"
}
Configuration
...
intervention:
  plugin: "dc_measurements/Intervention"
  topic_output: "/dc/measurement/intervention"
  group_key: "intervention"
  velocity_topics: ["/cmd_vel_smoothed", "/teleop/cmd_vel"]
  velocity_modes: ["autonomous", "teleop"]
  velocity_timeout_s: 1.0
Example output
Start:
{
  "event": "start",
  "from_mode": "autonomous",
  "to_mode": "teleop",
  "previous_duration": 412.5,
  "sequence": 7,
  "open": true
}
and end:
{
  "event": "end",
  "from_mode": "teleop",
  "to_mode": "autonomous",
  "previous_duration": 37.2,
  "sequence": 8,
  "open": false
}
Ip Camera
Description
Records video in small segments (in case of a cut) and store it locally. They are first stored in a temporary folder. Once the record (of e.g 10 seconds) is done, it is moved to another directory.
Compared to other plugins, the collect function only moves the files from the temporary location, it does not start the recording. It takes some time to establish connection, so we avoid doing this every time. Recording is started at initialization by an ffmpeg process and saved in HLS format.
Parameters
| Parameter | Description | Type | Default |
|---|---|---|---|
| input | Input url | str | N/A (Mandatory) |
| video | Enable video recording | bool | true |
| audio | Enable audio recording | bool | false |
| bitrate_video | Video bitrate | str([0-9]+[kmKM]) | "2M" |
| bitrate_audio | Audio bitrate | str([0-9]+[kmKM]) | "192k" |
| segment | Records by small segment, managed by ffmpeg | bool | true |
| segment_time | Duration of a segment | int (>0) | 10 |
| ffmpeg_log_level | Ffmpeg log level | str (See doc) | "info" |
| ffmpeg_banner | Show ffmpeg banner in console | bool | true |
| save_path | Path used to save files with ffmpeg, UTC date is used | str | "ffmpeg_%Y-%m-%dT%H:%M:%S" |
onConfigure() expands %Y/%M/%D/%H in the directory it creates
(dc_util::expand_time(storage_dir_)), but collect() later iterates storage_dir_
unexpanded, as a literal path — and the default global save_local_base_path
($HOME/ros2/data/%Y/%M/%D/%H, see Measurements) contains exactly
those placeholders. The first collect() call throws an uncaught
std::filesystem::filesystem_error ("cannot open directory: No such file or directory")
and takes down the whole measurement_server process, along with every other Measurement
it runs. This is a known issue, still unfixed. Set a save_local_base_path with no %
placeholders (e.g. /var/lib/dc) to avoid it; save_path itself is unaffected, since only
its parent directory is extracted into storage_dir_.
Schema
{
    "$schema": "http://json-schema.org/draft-07/schema#",
    "title": "Ip Camera",
    "description": "Local and remote path where the remote camera video is recorded",
    "properties": {
        "local_path": {
            "description": "Local video path",
            "type": "string"
        },
        "remote_path": {
            "description": "Remote video path",
            "type": "string"
        }
    },
    "type": "object"
}
Configuration
...
ip_camera:
  plugin: "dc_measurements/IpCamera"
  topic_output: "/dc/measurement/ip_camera"
  input: "rtsp://192.168.0.10:554/stream1"
  segment_time: 10
  save_path: "ip_camera/%Y-%m-%dT%H-%M-%S"
Example output
Captured from a real run, input pointed at a real-time MPEG-TS/TCP test stream
(save_local_base_path overridden per the warning above):
{
  "data_src": "ip_camera",
  "flattened": false,
  "local_path": "/root/dc_capture_out/ip_camera/ffmpeg_2026-09-06T00:02:30.ts",
  "name": "ip_camera",
  "nested": false,
  "remote_path": "/ip_camera/ffmpeg_2026-09-06T00:02:30.ts",
  "run_id": "169",
  "timestamp": "ffmpeg_2026-09-06T00:02:30"
}
Manipulation
Description
Reports one MoveIt MoveGroup
goal's lifecycle: a manipulation_start Record when the goal is accepted, a manipulation_end
Record when it reaches a terminal state. This is a manipulation goal — it moves a robot
arm for one planning group. MoveIt has its own outcome vocabulary here: one flat signed
MoveItErrorCodes space, distinct from nav2's succeeded/failed/cancelled/aborted split used
by the Mission Measurements.
The Measurement is a passive observer: it never sends the goal itself. It reads the
action's status topic (<action_name>/_action/status, published for every goal the server knows
about, regardless of which client sent it) to see a goal appear and reach a terminal state, then
calls the action's get_result service -- a plain service any client may call given the goal's
UUID, not only the one that sent it -- to read MoveGroup::Result's error_code and
planning_time. group_name is this instance's own configuration rather than something read off
the goal: MoveGroup's Goal (the only place a group name appears) is sent privately to the
action server and never broadcast, so a passive observer structurally cannot see it. Run one
Manipulation Measurement instance per planning group your robot moves.
outcome on the end Record is derived from error_code, not from the action's own terminal
status: SUCCESS maps to succeeded, PREEMPTED maps to cancelled (the closest thing MoveIt
has), and every other -- necessarily negative -- MoveItErrorCodes value maps to failed.
sequence is a monotonically increasing counter across every Record this instance emits, so a
dropped Record shows up as a gap rather than silently corrupting a downstream count.
A goal still executing when collection stops simply never gets a matching manipulation_end
Record: nothing downstream can average an interval that was never closed as a zero, because there
is no end Record to average.
Parameters
| Parameter | Description | Default |
|---|---|---|
action_name | The MoveGroup action to watch | move_action |
group_name | The planning group this instance reports on the emitted Record | none, required |
Schema
{
  "$schema": "http://json-schema.org/draft-07/schema#",
  "title": "Manipulation",
  "description": "One MoveIt MoveGroup goal's lifecycle: a Record when it is accepted, one when it reaches a terminal state",
  "properties": {
    "event": {
      "description": "Whether this Record is the start or the end of one manipulation goal",
      "type": "string",
      "enum": ["manipulation_start", "manipulation_end"]
    },
    "goal_id": {
      "description": "The MoveGroup goal's own UUID, as a canonical hex string, correlating a start Record with its end",
      "type": "string"
    },
    "group_name": {
      "description": "The planning group this Measurement instance watches, as configured -- not read off the goal, which is never broadcast",
      "type": "string"
    },
    "sequence": {
      "description": "Monotonically increasing across every Record from this Measurement instance, so a dropped Record shows up as a gap",
      "type": "integer",
      "minimum": 1
    },
    "outcome": {
      "description": "Derived from MoveIt's own error_code: SUCCESS succeeds, PREEMPTED is the closest thing MoveIt has to cancelled, everything else fails",
      "type": "string",
      "enum": ["succeeded", "cancelled", "failed"]
    },
    "error_code": {
      "description": "MoveIt's own numeric MoveItErrorCodes, carried through verbatim",
      "type": "integer"
    },
    "planning_time": {
      "description": "Seconds MoveGroup spent planning, from MoveGroup::Result",
      "type": "number",
      "minimum": 0
    },
    "duration_sec": {
      "description": "How long the goal took from accepted to terminal",
      "type": "number",
      "minimum": 0
    }
  },
  "required": ["event", "goal_id", "group_name", "sequence"],
  "type": "object"
}
The full file (plugins/measurements/json/manipulation.json) also requires outcome,
error_code, planning_time and duration_sec on a manipulation_end Record.
Configuration
...
manipulation:
  plugin: "dc_measurements/Manipulation"
  topic_output: "/dc/measurement/manipulation"
  group_key: "manipulation"
  action_name: "move_action"
  group_name: "arm"
Example output
Start:
{
  "event": "manipulation_start",
  "goal_id": "3fa85f64-5717-4562-b3fc-2c963f66afa6",
  "group_name": "arm",
  "sequence": 5
}
and end:
{
  "event": "manipulation_end",
  "goal_id": "3fa85f64-5717-4562-b3fc-2c963f66afa6",
  "group_name": "arm",
  "sequence": 6,
  "outcome": "succeeded",
  "error_code": 1,
  "planning_time": 0.842,
  "duration_sec": 3.15
}
Map
Description
Save map using nav2_map_server and collect the map of the local map saved. The measurement also includes metadata: width, height and x and y origin.
Parameters
| Parameter | Description | Type | Default |
|---|---|---|---|
| quiet | Disable stdout for nav2 map saver | bool | true |
| save_base64 | Also save the PNG image as a base64 string, under base64.png | bool | false |
| save_path | Path to save the map to. Environment variables and datetime format are expanded | str | "map/%Y-%m-%dT%H:%M:%S" |
| save_map_timeout | Time to wait to save the map | float | 3.0 |
| topic | Topic to subscribe to to get the map | str | "/map" |
Schema
{
    "$schema": "http://json-schema.org/draft-07/schema#",
    "title": "Map",
    "description": "Map saved metadata and paths",
    "properties": {
        "resolution": {
            "description": "Resolution of the map, meters/pixel",
            "type": "number",
            "minimum": 0
        },
        "local_paths": {
            "description": "Paths where metadata and image are stored",
            "type": "object",
            "items": {
                "$ref": "#/$defs/paths"
            }
        },
        "remote_paths": {
            "description": "Dictionary of paths where metadata and image will be remotely stored",
            "type": "object",
            "additionalProperties": {
                "type": "object",
                "items": {
                    "$ref": "#/$defs/paths"
                }
            }
        },
        "origin": {
            "description": "Robot origin position in meters",
            "type": "object",
            "items": {
                "$ref": "#/$defs/origin"
            }
        },
        "width": {
            "description": "Width of the PGM",
            "type": "integer",
            "minimum": 0
        },
        "height": {
            "description": "Height of the PGM",
            "type": "integer",
            "minimum": 0
        }
    },
    "$defs": {
        "origin": {
            "type": "object",
            "description": "The 2-D pose of the lower-left pixel in the map, as (x, y, yaw), with yaw as counterclockwise rotation (yaw=0 means no rotation). Many parts of the system currently ignore yaw.",
            "properties": {
                "x": {
                    "description": "X origin of the robot",
                    "type": "number"
                },
                "y": {
                    "description": "Y origin of the robot",
                    "type": "number"
                }
            }
        },
        "paths": {
            "type": "object",
            "properties": {
                "png": {
                    "description": "Path to the map PNG file containing the image",
                    "type": "string"
                },
                "yaml": {
                    "description": "Path to the map YAML file containing map metadata",
                    "type": "string"
                },
                "pgm": {
                    "description": "Path to the map PGM file containing the gray-scale image",
                    "type": "string"
                }
            }
        }
    },
    "type": "object"
}
Configuration
...
map:
  plugin: "dc_measurements/Map"
  topic_output: "/dc/measurement/map"
  topic: "/map"
  save_path: "map/%Y-%m-%dT%H:%M:%S"
  save_map_timeout: 0.2
  quiet: true
  remote_keys: ["s3"]
Example output
A 4x4 test grid, captured without remote_keys configured (so no remote_paths):
{
  "flattened": false,
  "height": 4,
  "local_paths": {
    "pgm": "/tmp/dc_capture/map_out/2026-09-05T23:46:20.pgm",
    "png": "/tmp/dc_capture/map_out/2026-09-05T23:46:20.png",
    "yaml": "/tmp/dc_capture/map_out/2026-09-05T23:46:20.yaml"
  },
  "name": "map",
  "nested": false,
  "origin": {
    "x": 0.0,
    "y": 0.0
  },
  "resolution": 0.05000000074505806,
  "run_id": "169",
  "width": 4
}
Memory
Description
Collect memory used in percentage.
Parameters
This Measurement has no parameters beyond the common Plugin parameters.
Schema
{
    "$schema": "http://json-schema.org/draft-07/schema#",
    "title": "Memory",
    "description": "Memory used",
    "properties": {
        "used": {
            "description": "Memory used in percent",
            "type": "number",
            "minimum": 0
        }
    },
    "type": "object"
}
Configuration
...
memory:
  plugin: "dc_measurements/Memory"
  topic_output: "/dc/measurement/memory"
Example output
{
  "flattened": false,
  "name": "memory",
  "nested": false,
  "run_id": "169",
  "used": 91.44149017333984
}
Mission (nav2 FollowWaypoints)
Description
Reports the outcome of a nav2 FollowWaypoints mission -- a patrol or waypoint-following run,
including nav2's own per-waypoint failure reporting -- as one mission_start Record when a goal is
accepted and one mission_end Record when it reaches a terminal state. It is the FollowWaypoints
sibling of the NavigateToPose Mission Measurement (#387): same Record schema, same
mission_id/sequence conventions, its own mission_type.
This Measurement is a passive watcher: it never sends a FollowWaypoints goal
itself. Whatever already dispatches waypoint-following missions on the robot --
nav2_simple_commander, a WMS integration, a
teleop panel -- keeps doing exactly that; this Measurement only observes. That is a deliberate
match to every other Measurement's read-only relationship to the systems it reports on, and it is
also why it does not use rclcpp_action::Client's typed goal-tracking API: that API only reports
on goals the client itself sent. Instead it subscribes directly to the action's _action/status
topic (action_msgs/msg/GoalStatusArray, the same message type for every action) to see a goal get
accepted or reach a terminal state, and calls the action's _action/get_result service directly
once it does, to fetch the Result -- both standard, public parts of the ROS 2 action wire protocol
that any client may use, sender or not.
Known limitation: number_of_loops
nav2's FollowWaypoints goal carries a number_of_loops field (how many times to repeat the
route), but the goal itself is never re-published anywhere a third party can observe it -- only the
sender and the action server ever see it, and nothing in the ROS 2 action protocol (nor
rclcpp_action::Client's public API) lets a client that did not send a goal read it back. A
passive watcher therefore cannot report number_of_loops, and this Measurement's Records do not
carry it. Sending the goal itself instead of watching it would make this Measurement responsible
for driving navigation, contradicting DC's role as a telemetry pipeline (see CONTEXT.md) and
directly competing with whatever else already commands the same action -- e.g.
dc_demos/dc_demos/qrcodes_waypoint_follower.py, which already sends FollowWaypoints goals of
its own. If a deployment needs number_of_loops on this Record, it has to come from the mission
commander via a documented escape hatch (#305's territory), not from this adapter.
Parameters
| Parameter | Type | Default | Description |
|---|---|---|---|
action_name | string | follow_waypoints | The nav2 FollowWaypoints action to watch |
Schema
{
  "$schema": "http://json-schema.org/draft-07/schema#",
  "title": "MissionNav2FollowWaypoints",
  "properties": {
    "event": { "type": "string", "enum": ["mission_start", "mission_end"] },
    "mission_id": { "type": "string" },
    "mission_type": { "type": "string", "const": "follow_waypoints" },
    "sequence": { "type": "integer", "minimum": 1 },
    "outcome": { "type": "string", "enum": ["succeeded", "failed", "cancelled", "aborted"] },
    "reason": { "type": "string" },
    "error_code": { "type": "integer", "minimum": 0 },
    "duration_sec": { "type": "number", "minimum": 0 },
    "missed_waypoints": {
      "type": "array",
      "items": {
        "type": "object",
        "properties": {
          "index": { "type": "integer", "minimum": 0 },
          "error_code": { "type": "integer", "minimum": 0 }
        },
        "required": ["index", "error_code"]
      }
    }
  },
  "required": ["event", "mission_id", "mission_type", "sequence"],
  "type": "object"
}
outcome, duration_sec and missed_waypoints are required on mission_end only. reason and
error_code are required on mission_end when outcome is failed or aborted: failed is a
goal that reached nav2's GoalStatus.SUCCEEDED but whose FollowWaypoints::Result.error_code is
still non-zero -- nav2's WaypointFollower can finish a route having missed a waypoint without the
action itself aborting.
Configuration
...
mission:
  plugin: "dc_measurements/MissionNav2FollowWaypoints"
  topic_output: "/dc/measurement/mission"
  group_key: "mission"
  action_name: "follow_waypoints"
Example output
Start:
{
  "event": "mission_start",
  "mission_id": "3fa85f64-5717-4562-b3fc-2c963f66afa6",
  "mission_type": "follow_waypoints",
  "sequence": 5
}
end, succeeded:
{
  "event": "mission_end",
  "mission_id": "3fa85f64-5717-4562-b3fc-2c963f66afa6",
  "mission_type": "follow_waypoints",
  "sequence": 6,
  "outcome": "succeeded",
  "duration_sec": 184.2,
  "missed_waypoints": []
}
and end, failed on a missed waypoint:
{
  "event": "mission_end",
  "mission_id": "6c9f6a3e-2d1a-4e3a-9f7a-1b2c3d4e5f60",
  "mission_type": "follow_waypoints",
  "sequence": 8,
  "outcome": "failed",
  "reason": "task executor failed",
  "error_code": 601,
  "duration_sec": 92.6,
  "missed_waypoints": [
    { "index": 2, "error_code": 601 }
  ]
}
error_code is FollowWaypoints::Result.error_code verbatim -- in nav2_msgs, its only non-zero values are UNKNOWN (600) and TASK_EXECUTOR_FAILED (601); missed_waypoints[].error_code is nav2's per-waypoint error_code from the same table. nav2's WaypointStatus (new since Lyrical) also carries the waypoint's pose, a status enum and a free-text error_msg -- none part of this schema (the index key keeps the Jazzy-line Record shape downstream consumers already receive); reason/error_msg above are always the mission-level FollowWaypoints::Result.error_msg, not anything per-waypoint.
Mission Nav2 (NavigateToPose)
Description
The nav2 adapter of the Mission Measurement for nav2's NavigateToPose action -- a single-pose
navigation goal, the base case the mission lifecycle contract (#305, recorded in
ADR-0010)
was agreed against. Emits a
mission_start Record when a goal is accepted and a mission_end Record once it reaches a
terminal state. NavigateThroughPoses and FollowWaypoints are its siblings (#388/#389): same
Record schema, same mission_id/sequence conventions, each with its own mission_type.
This Measurement is a passive watcher: it never sends a NavigateToPose goal
itself. Whatever already dispatches navigation missions on the robot -- nav2's bt_navigator, a
fleet orchestrator, an operator command -- keeps doing exactly that; this Measurement only
observes. That is a deliberate match to every other Measurement's read-only relationship to the
systems it reports on, and it is also why it does not use rclcpp_action::Client's typed
goal-tracking API: that API only reports on goals the client itself sent. Instead it subscribes
directly to the action's _action/status (action_msgs/msg/GoalStatusArray, the same message
type for every action) and _action/feedback topics to see a goal get accepted, pick up its
recovery count, and reach a terminal state, and calls the action's _action/get_result service
directly once it does, to fetch the Result -- all standard, public parts of the ROS 2 action wire
protocol that any client may use, sender or not.
nav2's NavigateToPose action server processes one goal at a time, so this Measurement only ever
tracks one mission at once. A second goal accepted before the first reaches a terminal state is
logged and otherwise ignored -- it produces no Record of its own, and the mission already being
tracked is unaffected.
outcome on the end Record is one of succeeded, failed, cancelled, aborted: CANCELED
maps to cancelled, ABORTED to aborted (both carrying nav2's own error_msg/error_code as
reason/error_code), and SUCCEEDED maps to succeeded unless
NavigateToPose::Result.error_code is non-zero, in which case it is failed -- an
application-level failure nav2 reported without aborting the goal status itself.
recoveries (from NavigateToPose::Feedback.number_of_recoveries, when feedback was seen before
completion) is carried on the end Record when available.
A mission still running when collection stops simply never gets a matching mission_end Record:
nothing downstream can average an interval that was never closed as a zero, because there is no
mission_end Record to average. sequence is a monotonically increasing counter across every
Record this Measurement instance emits (start and end alike, not per mission_id), so a dropped
Record shows up as a gap rather than silently corrupting a duration or a mission-success-rate
denominator.
Parameters
| Parameter | Type | Default | Description |
|---|---|---|---|
action_name | string | navigate_to_pose | The nav2 NavigateToPose action to watch |
Schema
{
  "$schema": "http://json-schema.org/draft-07/schema#",
  "title": "MissionNav2",
  "properties": {
    "event": { "type": "string", "enum": ["mission_start", "mission_end"] },
    "mission_id": { "type": "string" },
    "mission_type": { "type": "string", "const": "navigate_to_pose" },
    "sequence": { "type": "integer", "minimum": 1 },
    "outcome": { "type": "string", "enum": ["succeeded", "failed", "cancelled", "aborted"] },
    "reason": { "type": "string" },
    "error_code": { "type": "integer", "minimum": 0 },
    "duration_sec": { "type": "number", "minimum": 0 },
    "recoveries": { "type": "integer", "minimum": 0 }
  },
  "required": ["event", "mission_id", "mission_type", "sequence"],
  "type": "object"
}
outcome and duration_sec are required on mission_end only. reason and error_code are
required on mission_end when outcome is failed or aborted.
Configuration
...
mission:
  plugin: "dc_measurements/MissionNav2"
  topic_output: "/dc/measurement/mission"
  group_key: "mission"
  action_name: "navigate_to_pose"
Example output
Start:
{
  "event": "mission_start",
  "mission_id": "3fa85f64-5717-4562-b3fc-2c963f66afa6",
  "mission_type": "navigate_to_pose",
  "sequence": 7
}
and end (succeeded):
{
  "event": "mission_end",
  "mission_id": "3fa85f64-5717-4562-b3fc-2c963f66afa6",
  "mission_type": "navigate_to_pose",
  "sequence": 8,
  "outcome": "succeeded",
  "duration_sec": 96.4,
  "recoveries": 1
}
and end (aborted):
{
  "event": "mission_end",
  "mission_id": "6c9f6a3e-2d1a-4e3a-9f7a-1b2c3d4e5f60",
  "mission_type": "navigate_to_pose",
  "sequence": 10,
  "outcome": "aborted",
  "reason": "tf timeout",
  "error_code": 9102,
  "duration_sec": 12.1
}
Mission Nav2 (NavigateThroughPoses)
Description
The nav2 adapter of the Mission Measurement for nav2's NavigateThroughPoses action -- the
action a deployment issues when a mission is a single job through several hard-constraint poses
in one call, rather than a chain of separate NavigateToPose goals (that sibling adapter is
mission_nav2, #387). Emits a mission_start Record when a goal is first observed and a
mission_end Record once it reaches a terminal state, in the same Record schema #387 defines,
with mission_type: "navigate_through_poses".
This Measurement is a passive observer of the action server's single active goal. It
never sends a goal itself. Instead it subscribes to the action's own
_action/status and _action/feedback topics and calls its _action/get_result service
directly for whichever goal_id just reached a terminal status -- the same standard per-action
topics/services every rclcpp_action::Server (nav2's bt_navigator included) exposes. Whatever
in the deployment actually dispatches missions (a BT navigator, a fleet orchestrator, an
operator command) keeps doing so exactly as before; this Measurement only watches.
Two Records per mission:
- a
mission_startRecord, the first time a goal_id is observed on the action's status topic. - a
mission_endRecord, once that goal_id reaches a terminal status (SUCCEEDED,CANCELED, orABORTED) and its result has been fetched.
outcome on the end Record is one of succeeded, failed, cancelled, aborted:
CANCELED maps to cancelled, ABORTED to aborted (both carrying nav2's own
error_msg/error_code as reason/error_code), and SUCCEEDED maps to succeeded unless
NavigateThroughPoses::Result.error_code is non-zero, in which case it is failed -- an
application-level failure nav2 reported without aborting the goal status itself.
recoveries (from NavigateThroughPoses::Feedback.number_of_recoveries, when feedback was seen
before completion) is carried on the end Record when available.
No per-waypoint outcome is reported. The acceptance criteria this Measurement was built
against ask for the final waypoint_statuses (which poses in the job succeeded versus failed) to
be represented on mission_end, following an upstream nav2 NavigateThroughPoses.action result
field of that name. That field exists on the nav2 this repository actually builds against
(nav2_msgs from navigation2's main branch, pinned in ros2_data_collection.repos -- its
NavigateThroughPoses::Result carries WaypointStatus[] waypoint_statuses) but this Measurement
does not surface it yet: an earlier implementation reported it, and was trimmed when the
repository tracked a distro branch whose NavigateThroughPoses::Result had no such field
(fatal error: nav2_msgs/msg/waypoint_status.hpp: No such file or directory). Surfacing it again
against the current pin is a follow-up, not something this Measurement does today.
A mission still running when collection stops simply never gets a matching mission_end Record:
nothing downstream can average an interval that was never closed as a zero, because there is no
mission_end Record to average. sequence is a monotonically increasing counter across every
Record this Measurement instance emits (start and end alike, not per mission_id), so a dropped
Record shows up as a gap rather than silently corrupting a duration or a mission-success-rate
denominator.
Parameters
| Parameter | Default | Description |
|---|---|---|
action_name | navigate_through_poses | The NavigateThroughPoses action to watch. Its _action/status, _action/feedback, and _action/get_result endpoints are subscribed/called directly. |
Schema
{
  "$schema": "http://json-schema.org/draft-07/schema#",
  "title": "MissionNav2ThroughPoses",
  "properties": {
    "event": { "type": "string", "enum": ["mission_start", "mission_end"] },
    "mission_id": { "type": "string" },
    "mission_type": { "type": "string" },
    "sequence": { "type": "integer", "minimum": 1 },
    "outcome": { "type": "string", "enum": ["succeeded", "failed", "cancelled", "aborted"] },
    "reason": { "type": "string" },
    "error_code": { "type": "integer", "minimum": 0 },
    "duration_sec": { "type": "number", "minimum": 0 },
    "recoveries": { "type": "integer", "minimum": 0 }
  },
  "required": ["event", "mission_id", "sequence"],
  "type": "object"
}
Configuration
...
mission_nav2_through_poses:
  plugin: "dc_measurements/MissionNav2ThroughPoses"
  topic_output: "/dc/measurement/mission_nav2_through_poses"
  group_key: "mission"
  action_name: "navigate_through_poses"
Example output
Start:
{
  "event": "mission_start",
  "mission_id": "3f2504e04f8911d39a0c0305e82c3301",
  "mission_type": "navigate_through_poses",
  "sequence": 7
}
and end (succeeded):
{
  "event": "mission_end",
  "mission_id": "3f2504e04f8911d39a0c0305e82c3301",
  "mission_type": "navigate_through_poses",
  "sequence": 8,
  "outcome": "succeeded",
  "duration_sec": 96.4,
  "recoveries": 1
}
and end (aborted):
{
  "event": "mission_end",
  "mission_id": "9f86d081884c7d659a2feaa0c55ad015",
  "mission_type": "navigate_through_poses",
  "sequence": 10,
  "outcome": "aborted",
  "reason": "tf timeout",
  "error_code": 9102,
  "duration_sec": 12.1
}
Mission (Open-RMF)
Description
The Open-RMF adapter of the Mission Measurement for Open-RMF's TaskState (the document
rmf-web's API server maintains per task). Emits a mission_start Record when a task's status
first leaves queued/standby into an active state, and a mission_end Record once it reaches a
terminal status, in the same mission_start/mission_end Record schema #387 defines --
mission_id sourced from Open-RMF's own booking.id, mission_type from category (Open-RMF
tasks have a real category/type, unlike nav2's bare goal).
Unlike the nav2 adapters (mission_nav2/mission_nav2_follow_waypoints/
mission_nav2_through_poses), Open-RMF exposes no ROS action or topic for task lifecycle. This
Measurement instead consumes TaskState as a stream of JSON documents over a plain ws://
connection, using the reusable dc_common::WebSocketJsonClient. The websocket protocol
rmf-web's API server actually speaks on its own endpoints (Socket.IO framing) is out of scope
-- websocket_url must point at an endpoint that re-emits the task-state feed as one TaskState
JSON object per plain text frame; bridging the real rmf-web wire protocol is a separate piece of
infrastructure this Measurement assumes already exists, not something it does itself.
This Measurement is a passive observer. It never dispatches, cancels, or otherwise mutates any Open-RMF task -- it only watches the state stream.
Status mapping
Open-RMF's task model is richer than a flat start/end pair: TaskState.status is a
continuously-updated 12-value enum (uninitialized, blocked, error, failed, queued,
standby, underway, delayed, skipped, canceled, killed, completed). This
Measurement still boils it down to two Records per mission:
- a
mission_startRecord, the first time abooking.idis observed leavingqueued/standbyinto an active state --underway,delayed, or (once already active)blocked/error. - a
mission_endRecord, once thatbooking.idreaches a terminal status:completed,failed,canceled,killed, orskipped.
outcome on the end Record is one of succeeded, failed, cancelled, aborted:
completed→succeeded, failed→failed, canceled→cancelled, killed→aborted.
Two cases the acceptance criteria asked to be resolved explicitly, not silently defaulted:
skippedis treated as task-terminal, and maps to outcomecancelled. It is defined in the samestatusenumtask_state.jsonuses for the task's own top-levelstatusfield, the same enum that also carries in-progress phases, so a task can legitimately end its life withstatus: "skipped". Open-RMF'sskippedmeans the task's work was bypassed rather than performed, which is closer to DC'scancelled(the work simply didn't complete) than tosucceeded(the work was done) or a failure outcome. DC's outcome contract (#305/#387) has exactly four values; this Measurement maps into those four rather than adding a fifthskippedoutcome.blockedanderrorare treated as transient. Both describe a task Open-RMF is still actively trying to resolve or recover (a blocked path, a recoverable fault) -- they are absent fromtask_state.json's terminal set, so its task manager never settles on either as the end of the task's life. A task observed asblocked/errorstays open; only a later terminal status closes it, and it may still resolve back tounderway.
reason is populated on a best-effort basis, carried verbatim from whichever part of TaskState
Open-RMF actually populated for that outcome -- dispatch.errors (or the top-level detail) for
failed, cancellation.labels for cancelled, killed.labels for aborted. Unlike nav2's
always-present error_msg, Open-RMF does not guarantee one of these for every outcome, so reason
(and error_code, only ever populated for failed) may be absent even on a mission_end Record.
duration_sec prefers Open-RMF's own unix_millis_start_time/unix_millis_finish_time when the
source provided both; it falls back to this Measurement's own locally observed start/end
timestamps otherwise.
What this Measurement does not represent
- No phase-level detail.
TaskState.phases/active/completed/pending(which step of a multi-phase task is running) is not carried into the Record. Only the task's own top-levelstatusdrivesmission_start/mission_end. - No interruptions.
TaskState.interruptions(temporary holds placed on a task, distinct from cancellation) is not represented at all -- an interrupted-then-resumed task simply keeps running from this Measurement's point of view. - No dispatch/assignment detail. Which fleet or robot a task was assigned to
(
TaskState.assigned_to/dispatch.assignment) is not carried into the Record.
A task still active when the websocket connection drops or collection stops simply never gets a
matching mission_end Record: nothing downstream can average an interval that was never closed,
because there is no mission_end Record to average -- matching #387's open-interval handling.
Symmetrically, a task whose first-ever observed sample is already active (started before this
Measurement connected) or already terminal (finished before this Measurement connected) is not
tracked at all: no mission_start Record (the active-transition boundary was never observed) and
consequently no mission_end Record either.
Parameters
| Parameter | Default | Description |
|---|---|---|
websocket_url | (required) | ws://host[:port][/path] of the endpoint streaming TaskState JSON, one object per text frame. |
reconnect_initial_backoff_ms | 500 | Delay before the first reconnect attempt after a dropped connection. |
reconnect_max_backoff_ms | 30000 | Reconnect delay never grows past this, however many attempts fail in a row. |
Schema
{
  "$schema": "http://json-schema.org/draft-07/schema#",
  "title": "MissionOpenRmf",
  "properties": {
    "event": { "type": "string", "enum": ["mission_start", "mission_end"] },
    "mission_id": { "type": "string" },
    "mission_type": { "type": "string" },
    "sequence": { "type": "integer", "minimum": 1 },
    "outcome": { "type": "string", "enum": ["succeeded", "failed", "cancelled", "aborted"] },
    "reason": { "type": "string" },
    "error_code": { "type": "integer", "minimum": 0 },
    "duration_sec": { "type": "number", "minimum": 0 }
  },
  "required": ["event", "mission_id", "sequence"],
  "type": "object"
}
Configuration
...
mission_open_rmf:
  plugin: "dc_measurements/MissionOpenRmf"
  topic_output: "/dc/measurement/mission_open_rmf"
  group_key: "mission"
  websocket_url: "ws://rmf-task-state-bridge:8080/task_states"
Example output
Start:
{
  "event": "mission_start",
  "mission_id": "delivery.dispenser_1.dispatch-14",
  "mission_type": "delivery",
  "sequence": 3
}
end (succeeded):
{
  "event": "mission_end",
  "mission_id": "delivery.dispenser_1.dispatch-14",
  "mission_type": "delivery",
  "sequence": 4,
  "outcome": "succeeded",
  "duration_sec": 214.7
}
end (cancelled, cancellation labels present):
{
  "event": "mission_end",
  "mission_id": "patrol.loop_a.dispatch-22",
  "mission_type": "patrol",
  "sequence": 9,
  "outcome": "cancelled",
  "reason": "operator; dashboard",
  "duration_sec": 42.1
}
end (failed, dispatch error present):
{
  "event": "mission_end",
  "mission_id": "delivery.dispenser_2.dispatch-31",
  "mission_type": "delivery",
  "sequence": 15,
  "outcome": "failed",
  "reason": "dispenser_unavailable: dispenser_1 did not respond",
  "error_code": 12,
  "duration_sec": 8.9
}
Network
Description
Collects ping value, whether or not the PC is online and interfaces available. ping()
opens an unprivileged ICMP "ping" socket (socket(AF_INET, SOCK_DGRAM, IPPROTO_ICMP)) —
no root or CAP_NET_RAW needed, only a permissive net.ipv4.ping_group_range (the Linux
default is permissive for the root group, which is what containers and most robot
processes run as). This works unmodified in a plain rootless Podman/Docker container, with
no --cap-add or --privileged needed.
Parameters
| Parameter | Description | Type | Default |
|---|---|---|---|
| ping_address | IP address to test the ping to | str | "8.8.8.8" |
| ping_timeout | Time in ms before ping times out. Offline if superior to it | int | 200 |
Schema
{
    "$schema": "http://json-schema.org/draft-07/schema#",
    "title": "Network",
    "description": "Network accessibility and information",
    "properties": {
        "ping": {
            "description": "Time to ping the host in ms",
            "type": "integer",
            "minimum": -1
        },
        "online": {
            "description": "If the pc is online",
            "type": "boolean"
        },
        "interfaces": {
            "description": "List of network interfaces",
            "type": "array",
            "items": {
                "type": "string"
            }
        }
    },
    "type": "object"
}
Configuration
...
network:
  plugin: "dc_measurements/Network"
  topic_output: "/dc/measurement/network"
  ping_address: 192.168.0.1
  ping_timeout: 500
Example output
Captured from a plain rootless Podman container, no special flags, ping_address pointed
at localhost:
{
  "flattened": false,
  "interfaces": ["lo", "tunl0", "enp0s31f6"],
  "name": "network",
  "nested": false,
  "online": true,
  "ping": 0,
  "run_id": "175"
}
The same container against a real external host (ping_address: 8.8.8.8):
{
  "flattened": false,
  "interfaces": ["lo", "tunl0", "enp0s31f6"],
  "name": "network",
  "nested": false,
  "online": true,
  "ping": 6,
  "run_id": "176"
}
And against an unreachable one (ping_address: 192.0.2.1, the timeout dropped to 300ms
for a fast test):
{
  "flattened": false,
  "interfaces": ["lo", "tunl0", "enp0s31f6"],
  "name": "network",
  "nested": false,
  "online": false,
  "ping": -1,
  "run_id": "177"
}
OS
Description
Collects the Operating System information: cpus, operating system name and kernel information
Parameters
This Measurement has no parameters beyond the common Plugin parameters.
Schema
{
  "$schema": "http://json-schema.org/draft-07/schema#",
  "title": "OS",
  "description": "OS, kernel and CPUs information",
  "properties": {
    "os": {
      "description": "Host distribution name",
      "type": "string"
    },
    "kernel": {
      "description": "Kernel version",
      "type": "string"
    },
    "cpu": {
      "description": "Number of CPUs",
      "type": "integer",
      "minimum": 0
    },
    "memory": {
      "description": "System memory",
      "type": "number",
      "minimum": 0
    }
  },
  "type": "object"
}
The Record's own field is cpus (plural) — os.cpp's collect() writes
data_json["cpus"], not data_json["cpu"] as the schema above declares. The
mismatch doesn't fail validation (an extra, unvalidated field isn't rejected without
additionalProperties: false), but don't rely on cpu showing up in a query.
Configuration
...
os:
  plugin: "dc_measurements/OS"
  topic_output: "/dc/measurement/os"
Example output
{
  "cpus": 8,
  "flattened": false,
  "kernel": "6.12.101+deb13-amd64",
  "memory": 23.23,
  "name": "os",
  "nested": false,
  "os": "Ubuntu 24.04.4 LTS",
  "run_id": "169"
}
Permissions
Description
Collect UID, GID, if a file or directory exists and its permissions (in rwx or integer format).
Parameters
| Parameter | Description | Type | Default |
|---|---|---|---|
| format | Format to collect permissions in | str(rwx or int) | "int" |
| path | Path to the file or directory to collect data from, support environment variables | str | N/A (mandatory) |
Schema
{
    "$schema": "http://json-schema.org/draft-07/schema#",
    "title": "Permissions",
    "description": "Permissions of a file/directory",
    "properties": {
        "uid": {
            "description": "File/directory User IDentifier",
            "type": "integer"
        },
        "gid": {
            "description": "File/directory Group IDentifier",
            "type": "integer"
        },
        "exists": {
            "description": "File/directory exists",
            "type": "boolean"
        },
        "permissions": {
            "description": "Permissions as rwx or integer",
            "type": "string"
        }
    },
    "type": "object"
}
permissions.cpp's collect() also adds user and group (the owning username/group
name from getpwuid/getgrgid) whenever the uid/gid resolves on the local system —
neither is in the schema above. Both fields are simply left out of the Record when the
file is owned by an id the container doesn't recognize (e.g. owned by the host rather than
the container).
Configuration
...
permission_home_dc:
  plugin: "dc_measurements/Permissions"
  topic_output: "/dc/measurement/permissions_home_dc"
  path: "$HOME/dc"
  format: "rwx"
Example output
{
  "exists": true,
  "flattened": false,
  "gid": 0,
  "group": "root",
  "name": "permission_home_dc",
  "nested": false,
  "permissions": "rwx------",
  "run_id": "169",
  "uid": 0,
  "user": "root"
}
Position
Description
Collect x, y and yaw of the robot.
Parameters
| Parameter | Description | Type | Default |
|---|---|---|---|
| global_frame | Global frame | str | "map" |
| robot_base_frame | Robot base frame | str | "base_link" |
| transform_timeout | TF Timeout to use for transformation | float | 0.1 |
Schema
{
    "$schema": "http://json-schema.org/draft-07/schema#",
    "title": "Position",
    "description": "Position and orientation of the robot",
    "properties": {
        "x": {
            "description": "X position of the robot",
            "type": "number"
        },
        "y": {
            "description": "Y position of the robot",
            "type": "number"
        },
        "yaw": {
            "description": "Yaw angle of the robot",
            "type": "number"
        }
    },
    "type": "object"
}
Configuration
...
position:
  plugin: "dc_measurements/Position"
  topic_output: "/dc/measurement/position"
Example output
{
  "flattened": false,
  "name": "position",
  "nested": false,
  "run_id": "169",
  "x": 0.0,
  "y": 0.0,
  "yaw": 0.0
}
Random
Description
Emits a randomly generated value on every polling interval. Useful for exercising the pipeline and Destinations without any robot infrastructure — the simplest possible Measurement plugin, and a deterministic, infrastructure-free Record source for load and backpressure testing.
Parameters
| Parameter | Description | Type | Default |
|---|---|---|---|
| type | Type of the generated value: integer or double | str | "integer" (Optional) |
| min | Minimum value (inclusive) of the generated range | double | 0.0 (Optional) |
| max | Maximum value of the generated range (inclusive for integer, effectively exclusive for double). Must be greater than min | double | 100.0 (Optional) |
| seed | Seed for the random number generator. A negative value seeds from a non-deterministic source; a non-negative value makes runs reproducible | int | -1 (Optional) |
Schema
{
    "$schema": "http://json-schema.org/draft-07/schema#",
    "title": "Random",
    "description": "Randomly generated value",
    "properties": {
        "value": {
            "description": "Randomly generated value within the configured range",
            "type": "number"
        }
    },
    "type": "object"
}
Configuration
...
random:
  plugin: "dc_measurements/Random"
  topic_output: "/dc/measurement/random"
  type: "double"
  min: 0.0
  max: 1.0
  seed: 42
Example output
{
  "flattened": false,
  "name": "random",
  "nested": false,
  "run_id": "169",
  "value": 0.8265497558024156
}
ROS2 control status
Description
Reports when a ros2_control controller or hardware component crosses into or out of the
active lifecycle state -- the state in which it is actually commanding or reading hardware.
Rather than polling list_controllers/list_hardware_components, Ros2ControlStatus subscribes to
the controller manager's own ~/activity topic
(controller_manager_msgs/ControllerManagerActivity), republished with transient-local QoS on
every controller/hardware-component lifecycle change, and feeds each component's stream of
(state, timestamp) samples to its own dc_common::StateTransitionDetector -- one detector per
component, mirroring Fault's per-component detector map, so components activate and deactivate
independently.
A Record is produced only for the boundary Intervention already reports in the same shape: a
transition into active starts one ("event": "start"), and a transition out of active ends
one ("event": "end"). A transition between two non-active states (e.g. unconfigured to
inactive during startup) crosses no boundary and produces nothing.
Every Record carries the component type (controller or hardware_component), its name, the
state it left (from_state) and entered (to_state), and how long the previous state had been
held (previous_state_duration_s) -- on a start Record, how long the component was out of
active before this; on an end Record, how long it had just been active. open is true on a
start Record and false on an end Record, so a component still active when collection stops
simply never gets a matching end Record and cannot be averaged as a zero. Every Record carries a
seq that increments by one across every controller and hardware component, so a dropped Record
is a detectable gap.
Parameters
| Parameter | Description | Type | Default |
|---|---|---|---|
| topic | Topic to subscribe to for controller manager activity | str | "/controller_manager/activity" (Optional) |
Schema
{
  "$schema": "http://json-schema.org/draft-07/schema#",
  "title": "Ros2ControlStatus",
  "properties": {
    "seq": { "type": "integer", "minimum": 1 },
    "component_type": { "type": "string", "enum": ["controller", "hardware_component"] },
    "component": { "type": "string" },
    "event": { "type": "string", "enum": ["start", "end"] },
    "from_state": { "type": "string", "enum": ["unconfigured", "inactive", "active", "finalized", "configuring", "cleaningup", "shuttingdown", "activating", "deactivating", "errorprocessing", "unknown"] },
    "to_state": { "type": "string", "enum": ["unconfigured", "inactive", "active", "finalized", "configuring", "cleaningup", "shuttingdown", "activating", "deactivating", "errorprocessing", "unknown"] },
    "previous_state_duration_s": { "type": "number", "minimum": 0 },
    "open": { "type": "boolean" }
  },
  "required": ["seq", "component_type", "component", "event", "from_state", "to_state", "previous_state_duration_s", "open"],
  "type": "object"
}
Configuration
...
ros2_control_status:
  plugin: "dc_measurements/Ros2ControlStatus"
  topic_output: "/dc/measurement/ros2_control_status"
  group_key: "ros2_control_status"
  topic: "/controller_manager/activity"
Example output
A start:
{
  "seq": 1,
  "component_type": "controller",
  "component": "diff_drive_controller",
  "event": "start",
  "from_state": "inactive",
  "to_state": "active",
  "previous_state_duration_s": 4.2,
  "open": true
}
and its end:
{
  "seq": 2,
  "component_type": "controller",
  "component": "diff_drive_controller",
  "event": "end",
  "from_state": "active",
  "to_state": "inactive",
  "previous_state_duration_s": 612.9,
  "open": false
}
Serial interface
Description
Reads line-delimited data off a configurable serial port (baud rate configurable) and parses each line into named fields, publishing them as a Record — for custom robot sensors/boards that talk over a UART/USB-serial link and never reach a ROS topic on their own.
The port is opened lazily, on the first poll after activation, and never on onConfigure() — an
unplugged or not-yet-connected device does not fail activation. Disconnection is detected two
ways: a hard read error (e.g. EIO on some USB-serial removal paths) closes the port
immediately; a hangup with no error (the more common case on a raw-mode, non-blocking read,
where read() returning 0 alone can't be told apart from "no data yet") is caught via
poll()'s POLLHUP/POLLERR. Either way the Measurement logs a warning, closes the file
descriptor, and keeps polling; the next poll after the device reappears reopens and resumes
normally, with no operator action needed and no busy-looping in between (opening only happens
once per polling_interval tick).
Only line-delimited framing (\n, with an optional trailing \r stripped) is implemented today;
framing is still a configuration knob for future framing modes. Only the most recently completed
line in a given poll is parsed — if several lines arrive within one polling_interval, earlier
ones are dropped, the same lossy-between-polls behavior other subscription/poll-driven
Measurements (e.g. cmd_vel, diagnostics) already have.
Two parsing modes are supported, both producing the same fields object shape:
delimiter: splits the line ondelimiterand assigns tokens tofieldsin order.regex: matches the line againstregexand assigns capture groups tofieldsin order.std::regex/ECMAScript has no native named-capture-group syntax, so "named groups" here means pairing each positional capture group with a name fromfields, in capture order.
If the token/capture count doesn't match the configured fields count, a warning is logged and
whatever fields do line up are still published — a malformed line degrades rather than drops.
Parameters
| Parameter | Description | Type | Default |
|---|---|---|---|
| port | Serial device path (e.g. /dev/ttyUSB0) | str | "" (required) |
| baud_rate | Baud rate: one of 1200/2400/4800/9600/19200/38400/57600/115200/230400 | int | 9600 |
| framing | Line framing mode; only "line" is implemented | str | "line" |
| parsing_type | "delimiter" or "regex" | str | "delimiter" |
| delimiter | Delimiter string used when parsing_type: delimiter | str | "," |
| regex | ECMAScript regex (with capture groups) used when parsing_type: regex | str | "" |
| fields | Ordered field names paired with delimiter tokens or regex capture groups | list[str] | [] (Optional) |
Schema
{
  "$schema": "http://json-schema.org/draft-07/schema#",
  "title": "SerialInterface",
  "description": "A line parsed off a configured serial port",
  "properties": {
    "raw": {
      "description": "The raw line read from the serial port, with any trailing CR/LF stripped",
      "type": "string"
    },
    "fields": {
      "description": "Named fields extracted from 'raw' per the configured parsing (delimiter split or regex capture groups)",
      "type": "object"
    }
  },
  "required": ["raw", "fields"],
  "type": "object"
}
Configuration
Delimiter split, e.g. a board emitting 23.5,60\n (temperature, humidity):
...
serial_sensor:
  plugin: "dc_measurements/SerialInterface"
  topic_output: "/dc/measurement/serial_sensor"
  port: "/dev/ttyUSB0"
  baud_rate: 9600
  parsing_type: "delimiter"
  delimiter: ","
  fields: ["temperature", "humidity"]
Regex capture groups, e.g. a board emitting T:23.5 H:60\n:
...
serial_sensor:
  plugin: "dc_measurements/SerialInterface"
  topic_output: "/dc/measurement/serial_sensor"
  port: "/dev/ttyUSB0"
  baud_rate: 9600
  parsing_type: "regex"
  regex: "^T:(\\d+\\.\\d+) H:(\\d+)$"
  fields: ["temperature", "humidity"]
Example output
Derived from the delimiter example above (23.5,60 split on , into fields: ["temperature", "humidity"]):
{
  "raw": "23.5,60",
  "fields": {
    "temperature": "23.5",
    "humidity": "60"
  }
}
Testing without hardware
The gtest suite (test/test_measurement_serial_interface.cpp) verifies this Measurement against
a virtual serial pair created with socat, no hardware required:
socat -d -d pty,raw,echo=0,link=/tmp/dc_serial_dev pty,raw,echo=0,link=/tmp/dc_serial_peer
The Measurement is pointed at /tmp/dc_serial_dev; the test writes fixture lines to
/tmp/dc_serial_peer. Killing and restarting socat against the same link= paths simulates an
unplug/replug cycle and exercises the reconnect path.
slam_toolbox quality
Description
Localization quality from two of slam_toolbox's
native ROS 2 topics: /pose (geometry_msgs/PoseWithCovarianceStamped), polled on the same
interval as every other Measurement, for a sample Record carrying the pose and its covariance;
and /slam_toolbox/loop_closure_event (slam_toolbox/LoopClosureEvent on slam_toolbox's
development branch — see the note below on why this Measurement doesn't depend on that type
directly) for a single-shot loop_closure Record per occurrence.
LoopClosureEvent carries nothing but its own timestamp — slam_toolbox doesn't say which nodes
closed the loop or by how much, only that one happened. The Record reflects that: loop_closure
has no fields beyond event. The KPI value is entirely in the timing of these Records against
each other and against the samples: loop closures per hour is a rate over how often
loop_closure Records land, and time since the last loop closure — how long the map has gone
without a correction — is a localization-drift risk indicator on its own, the way a growing gap
between battery samples reads as data loss rather than a battery at 0 %.
Every Record carries an event field naming which of the two it is:
event | When | Carries |
|---|---|---|
sample | Every polling interval, once /pose has published | x, y, yaw, and the diagonal covariance terms for each |
loop_closure | slam_toolbox reports one on /slam_toolbox/loop_closure_event | Nothing else — the occurrence is the fact |
The covariance terms are the diagonal of PoseWithCovariance's 6x6 matrix at the indices for x, y
and yaw — the same terms AMCL/robot_localization dashboards already chart, and the ones that read
as confidence on their own axis without needing the off-diagonal correlations.
Until /pose publishes at all, no sample Record is emitted: a gap means no localization data,
not a robot at the origin. A loop closure is queued the moment it's reported and leaves on the
next poll, one Record per poll, so it travels the same path as every other Record (Conditions,
incident buffering, Group) — the same convention Battery's charging-session
boundaries and Intervention's takeovers use.
slam_toolbox/LoopClosureEvent is declared on slam_toolbox's ros2 development branch but isn't
part of any released binary yet — verified directly against the actual ros-jazzy-slam-toolbox
package contents, which ship no msg/ interface headers for it at all, only the srv/ ones. A
compile-time dependency on that message can't build against a real installation today, so this
Measurement subscribes to loop_closure_topic with create_generic_subscription instead — the
same runtime-discovery mechanism dc_bridge's raw mode uses. The content is never decoded (the
Record only needs to know an occurrence happened, not what the message carried), and the topic's
actual type is discovered from the ROS graph once slam_toolbox starts advertising it, so this
Measurement keeps working whichever release adds the topic and whatever fields it ends up
carrying — no dc_measurements rebuild required.
Parameters
| Parameter | Description | Type | Default |
|---|---|---|---|
| pose_topic | Topic (geometry_msgs/PoseWithCovarianceStamped) to read localization pose from | str | "/pose" (Optional) |
| loop_closure_topic | Topic slam_toolbox reports loop closures on, subscribed generically (type discovered at runtime) | str | "/slam_toolbox/loop_closure_event" (Optional) |
Schema
{
  "$schema": "http://json-schema.org/draft-07/schema#",
  "title": "SlamToolboxQuality",
  "description": "Localization quality from slam_toolbox: a pose sample with covariance on the polling interval, plus a Record on every loop closure",
  "properties": {
    "event": { "type": "string", "enum": ["sample", "loop_closure"] },
    "x": { "type": "number" },
    "y": { "type": "number" },
    "yaw": { "type": "number" },
    "covariance_x": { "type": "number", "minimum": 0 },
    "covariance_y": { "type": "number", "minimum": 0 },
    "covariance_yaw": { "type": "number", "minimum": 0 }
  },
  "required": ["event"],
  "type": "object"
}
The full file (plugins/measurements/json/slam_toolbox_quality.json) also requires x, y,
yaw and all three covariance terms on a sample — loop_closure requires nothing beyond
event.
Configuration
...
slam_quality:
  plugin: "dc_measurements/SlamToolboxQuality"
  topic_output: "/dc/measurement/slam_quality"
  polling_interval: 1000
  pose_topic: "/pose"
  loop_closure_topic: "/slam_toolbox/loop_closure_event"
Example output
One sample:
{
  "event": "sample",
  "x": 1.42,
  "y": -0.63,
  "yaw": 0.71,
  "covariance_x": 0.008,
  "covariance_y": 0.011,
  "covariance_yaw": 0.004
}
A loop closure:
{
  "event": "loop_closure"
}
KPIs
tools/infrastructure/sql/kpi_views.sql defines dc_kpi_loop_closure_rate() (loop closures per
hour and seconds since the last one, over an arbitrary window) and dc_kpi_loop_closures_1h (the
same count bucketed hourly for charting) over this Measurement's loop_closure Records, following
the same convention as dc_kpi_intervention_rate(). The demo Grafana KPI dashboard charts loop
closures per hour; the robot dashboard charts the covariance trend directly from sample Records.
Speed
Description
Collect robot speed using the Odom topic.
Parameters
| Parameter | Description | Type | Default |
|---|---|---|---|
| odom_topic | Topic to subscribe to to get the odometry (nav_msgs/Odometry) | str | "/odom" |
Schema
{
    "$schema": "http://json-schema.org/draft-07/schema#",
    "title": "Speed",
    "description": "Computed, linear and angular speed of the robot",
    "properties": {
        "computed": {
            "description": "Computed speed in meter/s",
            "type": "number"
        },
        "linear": {
            "description": "Linear velocity as a vector",
            "type": "object",
            "items": {
                "$ref": "#/$defs/vector3"
            }
        },
        "angular": {
            "description": "Angular velocity as a vector",
            "type": "object",
            "items": {
                "$ref": "#/$defs/vector3"
            }
        }
    },
    "$defs": {
        "vector3": {
            "type": "object",
            "properties": {
                "x": {
                    "description": "X speed",
                    "type": "number"
                },
                "y": {
                    "description": "Y speed",
                    "type": "number"
                },
                "z": {
                    "description": "Z speed",
                    "type": "number"
                }
            }
        }
    },
    "type": "object"
}
Configuration
...
speed:
  plugin: "dc_measurements/Speed"
  topic_output: "/dc/measurement/speed"
  odom_topic: "/odom"
Example output
{
  "angular": {
    "x": 0.0,
    "y": 0.0,
    "z": 0.0
  },
  "computed": 0.5,
  "flattened": false,
  "linear": {
    "x": 0.5,
    "y": 0.0,
    "z": 0.0
  },
  "name": "speed",
  "nested": false,
  "run_id": "169"
}
Storage
Description
Collect storage information on a directory.
Parameters
| Parameter | Description | Type | Default |
|---|---|---|---|
| path | Absolute path to the directory to inspect, expect environment variables | str | N/A (Mandatory) |
Schema
{
"$schema": "http://json-schema.org/draft-07/schema#",
"title": "Storage",
"description": "Storage information of a directory",
"properties": {
"free_percent": {
"description": "Free space on the filesystem, in percent",
"type": "number",
"minimum": 0
},
"free": {
"description": "Free space on the filesystem, in bytes",
"type": "integer",
"minimum": 0
},
"capacity": {
"description": "Total size of the filesystem, in bytes",
"type": "integer",
"minimum": 0
}
},
"type": "object"
}
Configuration
...
storage_home:
plugin: "dc_measurements/Storage"
topic_output: "/dc/measurement/storage_home"
path: "$HOME"
Example output
{
"capacity": 460041527296,
"flattened": false,
"free": 74388291584,
"free_percent": 11.073844909667969,
"name": "storage_home",
"nested": false,
"run_id": "169"
}
String stamped
Description
Collect generic data from a topic publishing a StringStamped message and republish it. It allows to fetch data from rclc, rclpy and your custom ROS 2 nodes that don't have use a plugin.
Parameters
| Parameter | Description | Type | Default |
|---|---|---|---|
| timer_based | If true, collect data at interval and if false collect every record and ignores polling_interval | bool | true |
| topic | Topic to get data from | str | N/A (mandatory) |
Schema
Given that the data is customized here, there is no default schema.
Configuration
...
my_data:
plugin: "dc_measurements/StringStamped"
topic_output: "/dc/measurement/my_data"
topic: "/hello_world"
timer_based: true
enable_validator: false # no schema exists for custom, per-topic data -- see Schema above
Example output
{
"flattened": false,
"name": "string_stamped",
"nested": false,
"run_id": "169",
"temperature": 21.5
}
TCP Health
Description
Collects status of a TCP server.
Parameters
| Parameter | Description | Type | Default |
|---|---|---|---|
| name | Alias to give to the TCP Server | str | N/A (Mandatory) |
| host | Name of the target host or IP address to check | str | "127.0.0.1" (Optional) |
| port | TCP port where to perform the connection check. | int(>0 <65536) | 80 (Optional) |
Schema
{
"$schema": "http://json-schema.org/draft-07/schema#",
"title": "TCP Health",
"description": "Status of a TCP server",
"properties": {
"host": {
"description": "Server hostname",
"type": "string"
},
"port": {
"description": "Port number",
"type": "integer",
"minimum": 1,
"maximum": 65536
},
"server_name": {
"description": "Server alias, from the 'name' parameter",
"type": "string"
},
"active": {
"description": "Whether the TCP connection check succeeded",
"type": "boolean"
}
},
"type": "object"
}
tcp_health.json (the schema file this block is copied from) is wrong twice: active
— the boolean connection-health result collect() actually writes — isn't declared as
a property at all, and server_name's own description says "Time the system has been
up", copy-pasted from uptime.json. Corrected above; the schema file itself still has
both bugs.
Configuration
...
tcp_health:
plugin: "dc_measurements/TCPHealth"
topic_output: "/dc/measurement/rustfs_health"
group_key: "rustfs_health"
host: "127.0.0.1"
port: 9000
name: "rustfs_api"
Example output
{
"active": true,
"flattened": false,
"host": "127.0.0.1",
"name": "tcp_health",
"nested": false,
"port": 9000,
"run_id": "169",
"server_name": "test_service"
}
Thermal
Description
Reports temperatures (CPU, GPU, board, ...) from the kernel's thermal sysfs interface
(/sys/class/thermal/thermal_zone*/), so overheating trends reach dashboards before they
become failures. Zones are auto-discovered by default; each zone's type string (e.g.
x86_pkg_temp, cpu-thermal) is used as the Record key, not its numeric index, since zone
numbering is platform-specific and differs between x86_64 and ARM targets. A missing or
unreadable /sys/class/thermal (e.g. a container without the host's thermal sysfs mounted)
degrades gracefully: activation still succeeds, and if no zone can currently be read the
Measurement publishes nothing that cycle (the same "silent, retry next poll" contract other
hardware-optional Measurements like Serial interface use) instead of failing or publishing an
empty Record.
Parameters
| Parameter | Description | Type | Default |
|---|---|---|---|
| base_path | Directory to scan for thermal_zone* entries | str | "/sys/class/thermal" (Optional) |
| zones | Explicit list of zone directory names (e.g. ["thermal_zone0", "thermal_zone2"]) to read instead of auto-discovering every thermal_zone* entry under base_path | list of str | [] (Optional) |
Schema
Zone type strings are the field names, so they can't be listed ahead of time — the schema constrains their shape instead: at least one entry (the Measurement publishes nothing rather than an empty Record), a non-empty type string as key, and a temperature in degrees Celsius above absolute zero as value.
{
"$schema": "http://json-schema.org/draft-07/schema#",
"title": "Thermal",
"description": "One entry per thermal zone read this cycle, keyed by the zone's type string",
"propertyNames": {
"description": "The zone's type string, e.g. x86_pkg_temp or cpu-thermal",
"minLength": 1
},
"additionalProperties": {
"description": "Temperature of the zone in degrees Celsius",
"type": "number",
"minimum": -273.15
},
"minProperties": 1,
"type": "object"
}
Configuration
...
thermal:
plugin: "dc_measurements/Thermal"
topic_output: "/dc/measurement/thermal"
Example output
On a host exposing a CPU package zone and a GPU zone:
{
"x86_pkg_temp": 52.0,
"gpu-thermal": 61.5
}
Uptime
Description
Time since when the robot PC has been on.
Parameters
This Measurement has no parameters beyond the common Plugin parameters.
Schema
{
"$schema": "http://json-schema.org/draft-07/schema#",
"title": "Uptime",
"description": "Time the system has been up",
"properties": {
"time": {
"description": "Time the system has been up",
"type": "integer",
"minimum": 0
}
},
"type": "object"
}
Configuration
...
uptime:
plugin: "dc_measurements/Uptime"
topic_output: "/dc/measurement/uptime"
Example output
{
"flattened": false,
"name": "uptime",
"nested": false,
"run_id": "169",
"time": 1783191
}
Overview
Description
A condition enables or disables one or multiple measurements to be published and thus collected. We could for example enable collecting camera images only when a robot is stopped.
Each condition is enabled or disabled through a pluginlib plugin. It has these configuration parameters.
A Condition gates collection for as long as its predicate holds, giving you data from the moment it became true onward. For what happened before an event, use a Trigger instead — built from the same Condition plugins, it fires once on the false→true edge and releases a window a Measurement had already buffered.
Wiring a Condition to a Measurement
Configuring a Condition is a two-step wire-up, both under measurement_server:
- Declare it in
condition_pluginsand give it its own named block, exactly like a Measurement —pluginnames the pluginlib class, and any other keys are that Condition's own parameters. - Reference that name from a Measurement's
if_all_conditions,if_any_conditions,if_none_conditions, orgate_condition(see Measurements). The Measurement is what names the Condition — nothing on the Condition side says which Measurement it gates, so one Condition can gate several Measurements at once.
The camera-only-when-stopped example above, taken from a real demo
(dc_demos/params/qrcodes_stdout.yaml):
measurement_server:
ros__parameters:
condition_plugins: ["moving"]
moving:
plugin: "dc_conditions/Moving"
right_camera:
plugin: "dc_measurements/Camera"
if_none_conditions: ["moving"] # collect only while NOT moving
topic_output: "/dc/measurement/right_camera"
cam_topic: "/right_intel_realsense_r200_depth/image_raw"
Available plugins:
| Name | Description |
|---|---|
| Compare | Value of a key compares to the configured operand (eq / ne / gt / ge / lt / le / match / exists) |
| Robot moving | Robot is moving |
| Same as previous | Value of the key is the same as the previous one |
Compare
Description
Compare the value of a JSON key against a configured operand and activate while the comparison
holds. One plugin covers the whole family: comparison picks the operator and the type you give
value picks the operand type (the two axes thirteen former per-operator plugins each
hard-coded).
Parameters
| Parameter | Description | Type | Default |
|---|---|---|---|
| key | JSON key where value is located, separate nested dictionary with / | str | N/A (Mandatory) |
| comparison | Operator: eq, ne, gt, ge, lt, le, match or exists | str | N/A (Mandatory) |
| value | Operand to compare the JSON value against; its type selects the operand type: bool, int, float, str, list[bool], list[int], list[float] or list[str] | any of those | N/A (Mandatory, except for match and exists) |
| regex | Regex the JSON value must fully match | str | N/A (Mandatory for match) |
| order_matters | For list operands: compare element order (true) or as unordered multisets (false) | bool | true |
The JSON comparison is type-strict: a Record field written as 5 is an integer and never
matches a float operand (and 5.0 never matches an int one). gt/ge/lt/le need an
int or float operand; ne inverts eq for every operand type.
Configuration
Only forward a TCP Health Record when the check actually
failed — suppressing the steady stream of active: true polls and keeping only outage alerts:
measurement_server:
ros__parameters:
condition_plugins: ["endpoint_down"]
endpoint_down:
plugin: "dc_conditions/Compare"
key: "active"
value: false
comparison: "eq"
rustfs_health:
plugin: "dc_measurements/TCPHealth"
if_all_conditions: ["endpoint_down"]
topic_output: "/dc/measurement/rustfs_health"
host: "127.0.0.1"
port: 9000
name: "rustfs_api"
A dead-band on Distance traveled — filters out both
"parked" noise and implausibly large jumps (dc_demos/params/tb3_simulation_pgsql_minio.yaml):
measurement_server:
ros__parameters:
condition_plugins: ["min_distance_traveled", "max_distance_traveled"]
min_distance_traveled:
plugin: "dc_conditions/Compare"
key: "distance_traveled"
value: 0.01
comparison: "ge"
max_distance_traveled:
plugin: "dc_conditions/Compare"
key: "distance_traveled"
value: 2.0
comparison: "le"
distance_traveled:
plugin: "dc_measurements/DistanceTraveled"
if_all_conditions: ["min_distance_traveled", "max_distance_traveled"]
topic_output: "/dc/measurement/distance_traveled"
Only publish Fast DDS statistics once its discovered
hosts list no longer matches the expected single-host fingerprint — flags an unexpected extra
participant joining the DDS graph:
measurement_server:
ros__parameters:
condition_plugins: ["known_hosts"]
known_hosts:
plugin: "dc_conditions/Compare"
key: "hosts"
value: ["d:14058711922191368192"]
comparison: "eq"
order_matters: false
fastdds_stats:
plugin: "dc_measurements/FastddsStats"
if_none_conditions: ["known_hosts"]
topic_output: "/dc/measurement/fastdds_stats"
Only collect a Battery Record while it is actively charging
(match uses a full regex match, and exists tests only that key is present, taking no
value):
measurement_server:
ros__parameters:
condition_plugins: ["actively_charging", "inspected_exists"]
actively_charging:
plugin: "dc_conditions/Compare"
key: "power_supply_status"
comparison: "match"
regex: "charging|full"
inspected_exists:
plugin: "dc_conditions/Compare"
key: "inspected"
comparison: "exists"
battery:
plugin: "dc_measurements/Battery"
if_all_conditions: ["actively_charging", "inspected_exists"]
topic_output: "/dc/measurement/battery"
Migration from the former per-operator plugins
| Former plugin | comparison | value type | Notes |
|---|---|---|---|
dc_conditions/BoolEqual | eq | bool | |
dc_conditions/DoubleEqual | eq | float | |
dc_conditions/IntegerEqual | eq | int | |
dc_conditions/DoubleInferior | le or lt | float | le was include_value: true, lt false |
dc_conditions/IntegerInferior | le or lt | int | same include_value mapping |
dc_conditions/DoubleSuperior | ge or gt | float | ge was include_value: true, gt false |
dc_conditions/IntegerSuperior | ge or gt | int | same include_value mapping |
dc_conditions/ListBoolEqual | eq | list[bool] | order_matters unchanged |
dc_conditions/ListDoubleEqual | eq | list[float] | order_matters unchanged |
dc_conditions/ListIntegerEqual | eq | list[int] | order_matters unchanged |
dc_conditions/ListStringEqual | eq | list[str] | order_matters unchanged |
dc_conditions/StringMatch | match | none | regex parameter unchanged |
dc_conditions/Exist | exists | none | key only |
ne (value differs) and scalar str equality are new with Compare.
Moving
Description
Use a hysteresis on robot position to know whether the robot is moving.
Parameters
| Parameter | Description | Type | Default |
|---|---|---|---|
| odom_topic | Topic from where odom is used to know if the robot is moving | str | "/odom" |
| speed_threshold | Speed threshold used in the hysteresis | float | 0.2 |
| count_limit | Counter to know if the robot is moving | int | 8 |
| count_hysteresis | Hysteresis counter | int | 5 |
Configuration
Only record camera images while the robot is stationary
(dc_demos/params/qrcodes_stdout.yaml):
measurement_server:
ros__parameters:
condition_plugins: ["moving"]
moving:
plugin: "dc_conditions/Moving"
right_camera:
plugin: "dc_measurements/Camera"
if_none_conditions: ["moving"]
topic_output: "/dc/measurement/right_camera"
cam_topic: "/right_intel_realsense_r200_depth/image_raw"
Same as previous
Description
Compare JSON key value to the value passed in parameter and returns true if match.
Parameters
| Parameter | Description | Type | Default |
|---|---|---|---|
| keys | JSON keys where values are located, separate nested dictionary with / | list[str] | N/A (Mandatory) |
| exclude | JSON keys to exclude in comparison | list[str] | N/A (Mandatory) |
Configuration
Skip republishing Diagnostics when nothing has changed
since the last collection — /diagnostics is typically high-volume and mostly unchanging:
measurement_server:
ros__parameters:
condition_plugins: ["diagnostics_unchanged"]
diagnostics_unchanged:
plugin: "dc_conditions/SameAsPrevious"
keys: []
exclude: []
diagnostics:
plugin: "dc_measurements/Diagnostics"
if_none_conditions: ["diagnostics_unchanged"]
topic_output: "/dc/measurement/diagnostics"
level_threshold: "WARN"
names: ["motor_driver", "battery"]
Triggers
Description
A Trigger fires a one-shot signal — a dc_interfaces/msg/FlushEvent — when a composition
of Conditions goes from false to true. Measurements listening for that
event release the window of recent data they have been holding back, so the seconds leading
up to an event are collected too, alongside the seconds after it.
The motivating case is incident review: when an autonomous robot emergency-brakes, what matters is what happened before the brake. A Condition cannot express that — it gates collection going forward, and by the time it turns true the run-up is gone. A Trigger can, because the Measurement was already buffering.
Trigger vs Condition
Both are described with the same if_all/if_any/if_none Condition lists, and a Trigger is
built out of Condition plugins — but they answer different questions.
| Condition | Trigger | |
|---|---|---|
| Question it answers | "Should this Measurement be collecting right now?" | "Did something just happen?" |
| Shape of the signal | A level: true for as long as the predicate holds | An edge: fires once on the false→true transition |
| Effect on collection | Gates live publishing while true | Releases a pre-collected buffer, once |
| Data it can give you | Everything from the moment it turned true | Everything from the buffer_duration_sec before the event, plus post-roll |
| Where it is configured | Per Measurement (if_all_conditions, …) | On the trigger_broadcast_node, once for the whole robot |
| How Measurements see it | Directly, as their own gate | Indirectly, as a FlushEvent on a topic several Measurements can share |
| Scope | One Measurement | Every Measurement subscribed to its flush_topic |
They compose: a Trigger is made of Conditions, and a buffering Measurement can still be gated by its own Conditions. Nothing about a Trigger changes what a Condition means.
Before this feature existed, "trigger" was loose talk for "a Condition turning on", and the glossary told you to avoid the word. It now names a real, distinct plugin type. Say Condition for a gate that stays true, and Trigger only for the edge-firing plugin documented here.
The flush broadcast
The trigger_broadcast_node loads the Condition plugins named in condition_plugins (the same
Condition plugins Measurements use) plus one Trigger plugin, polls the Trigger on a timer, and
publishes a FlushEvent on a configurable topic (/dc/flush by default) each time it fires:
┌──────────────────────┐
/odom, … ───────▶│ Condition plugins │
└──────────┬───────────┘
│ if_all / if_any / if_none
┌──────────▼───────────┐
│ Trigger (EdgeTrigger)│ false → true?
└──────────┬───────────┘
│ FlushEvent { incident_id }
┌──────────▼───────────┐
│ /dc/flush │
└───┬──────────────┬───┘
│ │
┌─────────▼────┐ ┌──────▼───────┐
│ Measurement A│ │ Measurement B│ release their buffered windows,
│ (buffering) │ │ (buffering) │ both tagged with the same incident_id
└──────────────┘ └──────────────┘
The node mints a fresh incident_id (a UUID) for every firing; nothing else generates one, so
every subscriber of one event shares one ID. Several Measurements can point at the same
flush_topic, which is the whole reason the signal is broadcast on a topic rather than wired
per Measurement: adding a sensor stream to an existing incident-capture setup needs no change
to the Trigger.
A Measurement passes its own freshly-collected Record to each Condition it consults, so
plugins like Compare read a field out of that Record. A Trigger has no Record of its
own: it only makes sense to compose Conditions that maintain their own state from a
subscription, such as Moving.
trigger_broadcast_node is a lifecycle node, like the Measurement server, but it is not part
of dc_bringup's launch file yet — run it alongside the rest of the stack and transition it
yourself (or add it to your own launch file and lifecycle manager node_names):
ros2 run dc_triggers trigger_broadcast_node --ros-args --params-file <your_params.yaml>
A Measurement subscribes to a plain topic, so anything publishing a FlushEvent on
flush_topic releases the buffer — including ros2 topic pub, which is how the
tools/e2e/scripts/run_incident.sh scenario drives a flush.
FlushEvent
dc_interfaces/msg/FlushEvent is the entire contract between the Trigger side and the
Measurement side:
| Field | Type | Description |
|---|---|---|
incident_id | string | UUID minted by the broadcast node, one per firing |
A Measurement adopts the incident_id it receives; it never generates its own. An event that
arrives while a Measurement is already flushing, in post-roll, or in cooldown is ignored.
incident_id
incident_id is a typed field of the dc_interfaces/msg/StringStamped Record envelope,
beside group_key — not a key nested inside the measurement's own data. Every Record and
File released by one flush cycle carries the same value, so "everything from this one event"
is a single query rather than a timestamp range reconstructed by hand:
SELECT * FROM dc_records WHERE incident_id = '3f2b1c7e-…' ORDER BY date;
- A
postgresDestination writes it to its ownincident_idcolumn — the column must exist in the table beforehand; see Destinations. - A Record collected outside an incident carries an empty
incident_id, leaving the column NULL. - A Group carries a member's envelope
incident_idonto its own output envelope, so grouping does not bury it. - Every Destination receives it as a top-level key of the JSON the Bridge ships: the Bridge lifts the envelope field into the payload before handing a Record to its Destinations.
Available plugins
| Name | Description |
|---|---|
| Edge trigger | Fires once on the false→true rising edge of an if_all/if_any/if_none Condition composition |
Node parameters
| Parameter name | Description | Type(s) | Default |
|---|---|---|---|
| condition_plugins | Name of the condition plugins to load | list[str] | [] |
Plugin parameters
Every Trigger plugin loaded by this node is namespaced under trigger and shares these
parameters:
| Parameter name | Description | Type(s) | Default |
|---|---|---|---|
| trigger.plugin | Name of the trigger plugin to load | str | N/A (mandatory) |
| trigger.if_all_conditions | Fire only once every named Condition is active | list[str] | [] |
| trigger.if_any_conditions | Fire once any named Condition is active | list[str] | [] |
| trigger.if_none_conditions | Fire only once no named Condition is active | list[str] | [] |
| trigger.topic | Topic FlushEvent messages are published on | str | "/dc/flush" |
| trigger.polling_interval | Interval in milliseconds at which the composed Condition state is checked | int | 100 |
Measurement parameters
The other half of the feature lives on each Measurement: what it buffers, and what it does
once a FlushEvent releases it. All five are optional, and a Measurement that leaves
buffer_duration_sec at 0 behaves exactly as it always has — this feature is entirely
opt-in. They are documented in full, with the state machine and how Files are staged, in
Measurements.
| Parameter name | Description | Type(s) | Default |
|---|---|---|---|
| buffer_duration_sec | Seconds of history to hold instead of publishing live; 0 disables buffering entirely | float | 0 |
| post_roll_duration_sec | Seconds to keep publishing live after the release finishes, still tagged with the same incident_id; 0 means pre-roll only | float | 0 |
| cooldown_sec | Seconds to ignore further FlushEvents once post-roll ends, before buffering re-arms itself; 0 re-arms immediately | float | 0 |
| max_flush_rate_hz | Ceiling in Records per second on how fast the released window is emitted; 0 releases it in one burst | float | 0 |
| flush_topic | Topic the FlushEvent that releases this Measurement is received on | str | "/dc/flush" |
An armed Measurement moves through four states per incident — Buffering (accumulate,
publish nothing) → Flushing (release the window, oldest first, rate-limited) →
PostRoll (publish live, same incident_id) → Cooldown (ignore further events) → back
to Buffering, with no manual re-arm.
A Measurement's data publisher is KeepLast(1). A whole window published back-to-back in one
callback is coalesced down to its last Record before any subscriber runs, so a burst release
(max_flush_rate_hz: 0) only delivers the full window to a subscriber that keeps up. Set a
rate comfortably above the collection rate being released — 20 Hz for a 2 Hz Measurement — and
the window is paced out intact, which is also what keeps a backlog dump from competing with
live collection right after an incident.
Example
An emergency-brake capture: the robot buffers the last 10 seconds of uptime data, and the
moment it starts moving the buffer is released and collection continues live for 5 more
seconds. Swap the moving Condition for whatever expresses your event.
trigger_broadcast_node's parameters:
trigger_broadcast_node:
ros__parameters:
condition_plugins: ["moving"]
moving:
plugin: "dc_conditions/Moving"
odom_topic: "/odom"
trigger:
plugin: "dc_triggers/EdgeTrigger"
if_all_conditions: ["moving"]
topic: "/dc/flush"
polling_interval: 100
The Measurements listening for it:
measurement_server:
ros__parameters:
measurement_plugins: ["uptime", "memory"]
# Armed: publishes nothing until a FlushEvent arrives on /dc/flush, then releases the
# last 10 seconds of collection tagged with that event's incident_id.
uptime:
plugin: "dc_measurements/Uptime"
polling_interval: 500
group_key: "uptime"
buffer_duration_sec: 10.0
post_roll_duration_sec: 5.0
cooldown_sec: 30.0
max_flush_rate_hz: 20.0
flush_topic: "/dc/flush"
# Not armed: collects live as usual, and its Records leave incident_id NULL.
memory:
plugin: "dc_measurements/Memory"
polling_interval: 1000
group_key: "memory"
A runnable end-to-end version of this — two Measurements, one armed, both landing in the same
Postgres table, with the incident_id column asserted by query — is
tools/e2e/scripts/run_incident.sh.
Edge trigger
Description
Composes the Condition plugins named in if_all_conditions/if_any_conditions/
if_none_conditions — the exact same rules Measurements already use — and fires exactly
once on the false→true rising edge of the composed result. A sustained true fires only
once; the Trigger stays quiet until the composed result falls back to false and rises
again. No rule-evaluation logic of its own: composition is entirely delegated to the same
ConditionSet evaluator dc_measurements::Measurement uses for live gating.
Parameters
See Plugin parameters — EdgeTrigger has no parameters
of its own beyond the shared trigger.* ones every Trigger plugin reads.
Trigger vs Condition
EdgeTrigger fires once per false→true transition; a Condition stays true and keeps gating
for as long as its predicate holds. See Trigger vs Condition.
Destinations
A Destination is an external system that receives Records or Files. In the DC 2.0
architecture (ADR-0003), the
pluginlib destination-plugin layer is retired. The Bridge (dc_bridge) renders the
external Vector Shipper's configuration from plain ROS parameters for a blessed
set of receives: records Destination types — file, vector — and every other
destination in Vector's sink catalog, including postgres, s3 and console, is
available through the passthrough: raw Vector config snippets listed in the
custom_config_files parameter, merged into the same rendered config (see
Passthrough below).
type: s3 also stays blessed, but only for receives: files Destinations — object
storage there is served entirely by the separate Uploader process reading these same ROS
params (ADR-0005), never by a
Vector sink, so there is no passthrough equivalent for it (see
File uploads below).
postgres/s3 (for receives: records)/console were blessed types through DC 2.0's
early releases; their dedicated ROS-param templating was removed in
#471/#472
once passthrough recipes for all three shipped
(#470) — see
Recipes below for the equivalent
snippets.
Verified sink versions
| Sink | Version verified |
|---|---|
| Vector (the Shipper itself) | 0.57.0 (vendored by vector_vendor) |
PostgreSQL (postgres) | 13.23 |
RustFS (s3) | v1.0.0-beta.11 |
| Elasticsearch (passthrough) | 8.19.5 |
| InfluxDB (passthrough) | 1.8.10 |
console and file write to local stdout/disk — no external version to track. Any
other passthrough sink is whatever's current in
Vector's own sink catalog for
the pinned 0.57.0 release above.
Three things on this page are a stable contract you can build against, not implementation detail:
- The configuration shape —
destinations: [...]plus one block per Destination withtype,receives,inputs, and that type's own fields. - The
dc.<tag>routes — one Shipper route per Tag, named deterministically from the topic. Passthrough snippets consume these. - The File status Record — the fields the Uploader writes under the
dc.filesTag.
Everything else the renderer emits (component ids other than the reserved ones, the exact TOML layout, Vector's own defaults) may change.
Bridge node parameters
| Parameter | Description | Type | Default |
|---|---|---|---|
destinations | Names of the Destinations to enable | list[str] | N/A (mandatory) |
shipper.data_dir | Directory for the Shipper's persistent disk buffer | str | "$HOME/.dc/buffer" |
shipper.buffer_max_bytes | Disk-buffer size; Vector rejects anything below ~256 MiB | int | Vector's minimum |
shipper.managed | true: the Bridge locates, spawns and supervises the Shipper. false (unmanaged, #444): the Bridge only renders the config and connects — an orchestrator owns the Shipper's lifecycle | bool | true |
shipper.config_path | Where the rendered Shipper config is written (atomically: write then rename); shared with the Shipper container/pod in unmanaged mode | str | a temp-file path |
shipper.bind_host | The fluent source's own listen address, embedded verbatim into the rendered config — distinct from vector_forward_host (below), which is where this Bridge process connects. Coincide in managed/native mode; diverge in split mode (#445/#447), where the Shipper binds 0.0.0.0 inside its own container while the Bridge connects by that container's DNS name | str | vector_forward_host's value |
uploader.data_dir | Directory for the Uploader's own durable intent queue and multipart-resume state (#441) — need not share a directory with the Shipper's disk buffer | str | shipper.data_dir's value |
custom_config_files | Raw Vector config snippets (TOML) to merge — the passthrough | list[str] | [] |
vector_forward_host | Host this Bridge process's Forwarder and readiness prober connect to — not necessarily where the Shipper itself listens (see shipper.bind_host) | str | "127.0.0.1" |
vector_forward_port | Port this Bridge process's Forwarder and readiness prober connect to | int | 24224 |
files.* | Uploader settings; see File uploads | — | — |
Deployment modes: shipper.managed
shipper.managed picks who owns the Shipper's process lifecycle. The Bridge renders the
same config and connects over the shipper ingest protocol the same way in both modes —
only whether it also locates, spawns and supervises the Vector binary changes.
shipper.managed: true (default) | shipper.managed: false | |
|---|---|---|
| Shipper supervised by | the Bridge (fork/exec + PR_SET_PDEATHSIG) | an external orchestrator (container runtime, Kubernetes, systemd, …) |
| Vector binary | the vendored one, located on AMENT_PREFIX_PATH | not located at all — the orchestrator runs its own (e.g. the upstream Vector image) |
vector validate at startup | yes, against the merged config | no — nothing to validate against without a binary |
shipper.config_path | usually left at its temp-file default | set to a path on a volume shared with the Shipper container/pod |
~/ready semantics | ready once the supervised Shipper accepts connections | identical: a TCP probe against vector_forward_host:vector_forward_port, independent of who spawned it |
Use shipper.managed: true (the default) for:
- Single-robot / simulation / demos — one process tree on one machine,
apt installor a workspace build, nothing else to run or orchestrate. This is what every demo under Demos and thedc_simulationwarehouse simulation use. - Local development and testing — fewer moving parts: no container runtime, no
volumes to wire up,
ros2 launch dc_bringup dc_bringup.launch.pyis the whole story.
Nothing about this mode changes with shipper.managed added — it is, and remains, the
default, and an existing deployment that never sets the parameter is unaffected.
Use shipper.managed: false for:
- Multi-container / orchestrator-managed deployments — Vector runs as its own
container (the upstream image, not the vendored binary) under Compose, Podman Quadlet
or Kubernetes, alongside the ROS/Bridge container on the same host. Set
shipper.config_pathto a path on a volume both containers mount, so the Bridge writes the config where the Shipper container reads it; the atomic write (below) is what makes that handoff safe even while the Shipper is already watching the file. - Per-component operations — separate logs (no ROS/Vector log interleaving), independent restarts, and orchestrator-native resource limits/credentials for the Shipper, without changing anything about how the Bridge renders or validates its config.
This parameter is the Bridge-side building block for the larger split-deployment and
fleet topologies tracked in #440. dc_uploader as its own process
(ADR-0014) and the blessed vector
Destination type for robot→edge forwarding have both since shipped; running dc_uploader
as its own container, with its own volumes and credentials, remains #447's work, not
shipped by shipper.managed alone.
Atomic config write
The rendered config is always written atomically — a full write to
<shipper.config_path>.tmp, then rename() over the real path — in both modes. A reader
polling the path (an unmanaged Shipper container watching a shared volume; vector validate in managed mode) can therefore never observe a partial write, regardless of how
large the config is or how the two containers' write/read timing lines up.
Configuration contract
Every Destination is declared in the destinations list of the dc_bridge node's
parameters, with a parameter block named after it (see
dc_bringup/params/dc_params.yaml for a complete commented example):
dc_bridge:
ros__parameters:
shipper:
data_dir: "$HOME/.dc/buffer" # Vector's disk-buffer directory
# buffer_max_bytes: 268435488 # optional; Vector's disk-buffer minimum
destinations: ["records_log", "to_aggregator", "rustfs"]
records_log:
type: file
receives: records
inputs: ["/dc/measurement/uptime"] # ROS topics feeding this Destination
path: "/var/log/dc/records-%Y-%m-%d.log" # Vector template syntax allowed
to_aggregator:
type: vector
receives: records
inputs: ["/dc/measurement/uptime"]
host: "edge-aggregator.local"
port: 6000
rustfs:
type: s3 # blessed only for `receives: files` — see below
receives: files
bucket: "dc-records"
endpoint: "http://127.0.0.1:9000" # omit for AWS S3
region: "us-east-1"
access_key_id: "rustfsadmin" # omit both to use ambient AWS credentials
secret_access_key: "$DC_S3_SECRET"
force_path_style: true # path-style addressing for self-hosted stores
key_prefix: "robot1/"
The vector type forwards to another Shipper over Vector's own native inter-instance
protocol (type = "vector" sink → type = "vector" source) — the standard way to chain
a robot's local Shipper to an edge aggregator's Shipper in a fleet deployment. host and
port name the downstream Shipper; there is no default for either, since there's no
sensible address to assume for another Shipper.
The s3 type — used above with receives: files — works with any S3-compatible store.
For self-hosting, RustFS (Apache 2.0, S3-compatible, a drop-in
MinIO replacement) is the recommended choice — MinIO's community edition was archived
upstream in 2026 and no longer receives maintenance — but existing MinIO or Ceph RGW
deployments work identically: set endpoint, explicit credentials, and (typically)
force_path_style: true. See File uploads
below for the full receives: files contract; batch_timeout_secs above is a
receives: records passthrough recipe field only (see
Recipes), not something the Uploader's
own S3 client uses.
Common parameters for every blessed type: type, receives (records | files, see
the File uploads section below), inputs (ROS topic names — required for receives: records; optional for receives: files, see below), time_key (default date) and
time_format (default epoch_nanos, receives: records only) controlling the
normalized timestamp field written into each Record before routing.
time_format
The Bridge forwards each Record's timestamp at full nanosecond resolution, taken from the
ROS message header. time_format decides how that is written into the Record:
| Value | Written as | Resolution kept |
|---|---|---|
epoch_nanos | integer nanoseconds since the epoch (default) | nanosecond — exact |
iso8601 | 2026-08-09T11:36:28.123456789 string | nanosecond |
double | fractional seconds as a float64 | ~microsecond, rounds |
double is lossy by construction, not by implementation: a float64 has ~15–16 significant
digits and current epoch seconds already consume 10 of them. It remains available for
consumers that want a fractional-seconds column, but it cannot represent the resolution
the pipeline delivers.
The destination's own column type can truncate independently of time_format. A
double precision column rounds an epoch_nanos value back off; PostgreSQL's native
timestamptz is microseconds internally; Elasticsearch's date type is milliseconds
(use date_nanos for the full value). Choose the column to match — bigint for
epoch_nanos is exact, sortable and indexable.
incident_id
A Measurement configured for incident capture tags every Record it
releases with the incident_id of the FlushEvent that released it. That field is typed on
the StringStamped Record envelope (#506), and the Bridge lifts it into a top-level key of
the payload JSON before handing a Record to its Destinations — no per-Destination
configuration is needed to expose it. A postgres sink (via the
passthrough recipe below) can therefore
write it straight into its own incident_id column with no extra mapping —
"everything from this one event" is a plain WHERE incident_id = '…' query — since
Vector's postgres sink has no column options of its own: a top-level event key lands in
the same-named column and everything else is dropped. The column has to exist in the
table before the first incident, exactly like every other column (tools/e2e/sql/init.sql
and tools/infrastructure/docker/config/postgresql/init.sql both carry it):
ALTER TABLE dc ADD COLUMN incident_id text;
Records collected outside an incident carry an empty incident_id, and an empty envelope
field is never lifted, leaving the column NULL.
Through #471, the blessed
postgres Destination additionally coerced incident_id to a string (or null) before
insertion, so a Measurement whose own payload happened to set a non-string incident_id
couldn't fail the whole insert batch. That coercion was Bridge-side templating specific
to the now-removed blessed postgres type and is not reproduced by the passthrough
recipe — in the (narrow) case where a Measurement's payload sets a non-string
incident_id, add your own remap transform ahead of the passthrough sink if this
matters for your data.
Type-specific parameters:
| Type | receives | Required | Optional |
|---|---|---|---|
file | records | path (Vector template syntax allowed) | |
vector | records | host, port | |
s3 | files | bucket | region, endpoint, key_prefix, access_key_id + secret_access_key (together), force_path_style |
postgres, s3 (for receives: records) and console are configured via the
passthrough instead — see
Recipes below.
Invalid parameters (unknown type, missing required field, half a credential pair, an
out-of-range port…) are rejected with a clear error at Bridge startup — before Vector
is ever started.
$VAR environment references are expanded by the Bridge in shipper.data_dir,
custom_config_files, and the secret_access_key credential — and nowhere else. In
particular file's path is handed to Vector verbatim, and Vector does not expand
environment variables there: path: "$HOME/records.ndjson" silently writes to a literal
$HOME directory beside the Bridge's working directory. Use an absolute path (Vector
creates missing parent directories).
The dc.<tag> routing contract (public API)
The Bridge exposes one Shipper route per Tag. The Tag for a topic is its name with
the leading / dropped and the remaining / turned into .
(/dc/measurement/uptime → dc.measurement.uptime), and its route is named
dc.<tag> — the leading dc. names the Bridge's route transform, the rest is the
Tag verbatim (so /dc/measurement/uptime's Records are consumable as
dc.dc.measurement.uptime). These names are stable public API: blessed sinks are
wired to them internally, and custom snippets consume them the same way. A route
exists for every topic listed in any configured Destination's inputs.
One route is not per-Tag: dc.dc.raw carries the whole dc.raw. Tag namespace when
raw topic collection is enabled. Raw mode discovers topics — and so
mints Tags — while the Shipper is already running, which no fixed set of exact-Tag
branches can cover, so that branch matches on the Tag prefix instead. It is consumable
from a snippet exactly like the others; each event still carries its own tag field.
Passthrough: custom_config_files
Any Vector sink type ships Records with zero DC code by consuming dc.<tag> routes
from a raw Vector config snippet (TOML):
# ~/.dc/custom_sinks.toml — an un-blessed sink type (http), pure Vector config
[sinks.my_http]
type = "http"
inputs = ["dc.dc.measurement.uptime"] # the public dc.<tag> route
uri = "http://127.0.0.1:8080/ingest"
encoding.codec = "json"
dc_bridge:
ros__parameters:
custom_config_files: ["$HOME/.dc/custom_sinks.toml"]
Snippets must not re-define component ids owned by the generated config (the
dc_bridge_in source, the dc_bridge_normalize and dc transforms, or any configured
Destination's name) or by another snippet. An invalid or colliding snippet is a loud
Bridge startup error naming the offending file. The Bridge then folds every validated
snippet into the same file it writes to shipper.config_path — one self-contained file
regardless of deployment mode, since in unmanaged mode
a snippet's own filesystem path is never wired into the separately-run Shipper container —
and, in managed mode, runs vector validate over that merged file as a backstop before
starting Vector. A snippet may define transforms as well as sinks — only defining a
reserved id is rejected, consuming one is not.
A snippet cannot route a topic on its own. The Bridge derives both its ROS subscriptions
and its dc.<tag> route branches from destinations, and never reads a snippet's
inputs — so every topic a snippet consumes must also appear in some blessed
Destination's inputs, and destinations must name at least one (a file Destination is
the cheapest way to satisfy that). Two consequences follow from the passthrough being
outside the rendered config: the snippet's sink gets Vector's default in-memory
buffer, not the disk buffer dc_bridge gives every blessed sink, and it is the
snippet's job to make re-delivery idempotent if the store cares — the Shipper is
at-least-once (ADR-0002) either way.
The Elasticsearch tutorial is the worked example for all of this, end to end; the InfluxDB demo is the same mechanism against a simulated robot. MCAP recording (ADR-0009, issue #210) is the same passthrough consumed by a standalone process instead of a Vector-native sink — the shape to follow for any store Vector has no sink for at all.
Recipes: postgres, s3, console via passthrough
Per ADR-0003, postgres, s3 (for receives: records) and console are pure
Vector-sink wrappers with no DC-specific logic layered on top — Vector's own vector validate already gives clear, field-level errors for these three sinks, so passthrough
loses nothing on the validation front for this subset. This is now the only way to
configure them: their dedicated ROS-param templating was removed in
#471/#472.
Each recipe below reproduces exactly what dc_bridge used to render for the equivalent
formerly-blessed configuration — confirmed by running Vector 0.57.0 against a live
PostgreSQL and RustFS instance, not just written by inspection.
As with any passthrough, at least one blessed Destination is still needed to create the
dc.<tag> route the snippet consumes — file is the cheapest (see
above). If you're migrating the console Destination
itself, keep a file Destination (or another cheap blessed type) as the route anchor
instead.
postgres — the former blessed form's host/port/user/password/database
collapse into a single connection-string endpoint; table is unchanged:
# ~/.dc/postgres_sink.toml — passthrough equivalent of the blessed `pgsql` Destination
[sinks.pgsql]
type = "postgres"
inputs = ["dc.dc.measurement.uptime"] # the public dc.<tag> route
endpoint = "postgres://dc:${DC_PG_PASSWORD}@127.0.0.1:5432/dc" # user:password@host:port/database
table = "dc"
[sinks.pgsql.buffer]
type = "disk"
max_size = 268435488 # Vector's disk-buffer minimum; a passthrough sink gets none by default
If user or password contain characters reserved in a URI (:, @, /, %),
percent-encode them yourself — the former blessed form did this automatically, but a
passthrough endpoint is handed to Vector verbatim.
s3 — Vector's own sink id is aws_s3, not s3; credentials move under
[sinks.<name>.auth] and batch_timeout_secs becomes [sinks.<name>.batch] timeout_secs:
# ~/.dc/s3_sink.toml — passthrough equivalent of the blessed `rustfs` Destination
[sinks.rustfs]
type = "aws_s3" # Vector's sink id — not "s3"
inputs = ["dc.dc.measurement.uptime"]
bucket = "dc-records"
endpoint = "http://127.0.0.1:9000" # omit for AWS S3
region = "us-east-1"
key_prefix = "robot1/"
force_path_style = true # path-style addressing for self-hosted stores
[sinks.rustfs.auth]
access_key_id = "rustfsadmin"
secret_access_key = "${DC_S3_SECRET}"
[sinks.rustfs.batch]
timeout_secs = 60 # object write interval; Vector default 300
[sinks.rustfs.buffer]
type = "disk"
max_size = 268435488
[sinks.rustfs.encoding]
codec = "json"
console — had no required fields either way, so this recipe mostly matters for
consistency with the other two:
# ~/.dc/console_sink.toml — passthrough equivalent of the blessed `console` Destination
[sinks.debug_console]
type = "console"
inputs = ["dc.dc.measurement.uptime"]
target = "stdout" # or "stderr"
[sinks.debug_console.encoding]
codec = "json"
Unlike the blessed form's password/secret_access_key (expanded by dc_bridge itself
before it ever writes a config file), the ${VAR} references above are Vector's own
interpolation and are otherwise off in the vendored Vector 0.57.0 binary dc_bridge
spawns — a snippet's ${VAR} is left as a literal string, silently sent as the password
verbatim (or rejected outright, if it contains a reserved URI character like the braces
here). Set VECTOR_DANGEROUSLY_ALLOW_ENV_VAR_INTERPOLATION=true in the environment that
launches the Bridge process itself (the vendored Vector inherits it) to make Vector honor
${VAR} inside passthrough snippet content. Without it, put the literal secret in the
file and rely on filesystem permissions instead.
File uploads: receives: files (the Uploader, ADR-0005, ADR-0014)
A Destination with receives: files (only type: s3 qualifies) is served by the
Uploader — dc_uploader, a separate process with its own Shipper connection
(ADR-0014) — not by a Vector sink:
Records arriving on its inputs topics are durably enqueued by the Bridge, then scanned
by dc_uploader for the local_paths/remote_paths File references Measurements embed
(camera, map, …), and each referenced File is uploaded (multipart + resumable for large
Files) to every receives: files Destination whose name appears as a key in
the Record's remote_paths — so the Destination name in the params file must match
the remote key the Measurement is configured with. The YAML config shape below is
unchanged by the split: dc_bringup.launch.py reads these same files.*/uploader.*
parameters from the dc_bridge params block and translates them into dc_uploader's own
DC_UPLOADER_* environment variables when it starts that process.
{
"name": "map",
"local_paths": { "yaml": "/tmp/map.yaml", "pgm": "/tmp/map.pgm" },
"remote_paths": { "rustfs": { "yaml": "robot/map.yaml", "pgm": "robot/map.pgm" } }
}
Per File the Uploader: uploads (multipart and resumable for large Files — an
interrupted transfer picks up from the last completed part after a reconnect or Bridge
restart, using progress checkpointed under <shipper.data_dir>/uploader/), verifies
the object landed (head + size comparison), extracts metadata (content type, size,
and duration via ffprobe for video/* Files), and emits a status Record under the
dc.files Tag, routed like any Record to the Destination named by
files.metadata_destination. Status rows preserve the Humble files_metrics shape —
group_name, robot_name/robot_id (when present in the Record), local_path,
remote_path (s3://bucket/key), storage_type, uploaded, on_filesystem,
deleted, content_type, size, duration, updated_at, plus thumbnail_path when
thumbnails are enabled — but
the log is
append-only: deletion appends a deleted: true row instead of updating one, and
PostgreSQL is only ever written through the Shipper's parameterized sink (no SQL
strings anywhere in DC).
Two guarantees consumers can rely on:
- Group completion markers: when one Record references several Files (map =
pgm+yaml, camera batches), a
kind: group_completeRecord listing every File is emitted only after all of them are verified on all their Destinations — a consumer querying mid-upload sees per-File rows but no marker, and never has to guess whether a group fully arrived. - Deletion only after verified upload: with
files.delete_when_sent: true, a local File is removed only once it is verified on every Destination that receives it. Retries are idempotent — already-verified objects are not re-uploaded and status rows are never duplicated.
Durability: the disk-backed intent queue
Neither a Bridge nor a dc_uploader restart ever forgets a pending upload — the intent
queue is a shared on-disk directory, not in-process state either owns exclusively.
Before a files-Destination's Record is ever handed to the Uploader, it is written to
disk as one intent — a JSON file
({version: 1, tag, timestamp, payload}) at
<shipper.data_dir>/queue/upload/<monotonic_ts>-<seq>.json, via tmp-write-then-rename
(crash-atomic; no fsync, matching Humble Fluent Bit's own storage.sync normal). The
intent leaves the queue only when its Record has been fully processed — every File
verified everywhere, or reported missing — never on a timer, a cap, or a drop-oldest
policy: an upload intent and its Files live and die together. On startup every intent
left over from a previous run is replayed, oldest-first, alongside live traffic; because
processing is idempotent (an already-verified object short-circuits, multipart resumes
from its checkpointed sidecar), a replayed intent can never re-upload or duplicate a
status row.
A permanently-failing intent cannot starve the rest of the backlog: each intent gets its
own exponential backoff (5 s, doubling, capped at 2000 s — Humble Fluent Bit's own
scheduler defaults) and the worker sweeps oldest-first, skipping whatever is still
backing off rather than retrying the same head-of-line entry forever. The queue's depth
is surfaced as a cheap observability hook in the ~/ready service's message text.
This is at-least-once, not exactly-once: a crash between a status Record being
forwarded and its intent being acked can replay that status Record after restart (the
Uploader's own dedup set is in-memory, so a fresh process may re-emit one it already
sent). Consumers should key on the latest row per (local_path, storage_type), same as
the Records path.
A Record referencing no Files is enqueued and acked in the same pass with no retries, so
it never lingers in the queue's steady state. Note that base64-heavy Records (e.g. a
map's save_base64: on) inline file content directly into the payload and so consume
queue-directory bytes proportionally faster than a plain File reference.
Thumbnails: optional previews for image and video Files
A dashboard drawing a grid of inspection photos otherwise pulls every full-size camera
JPEG — and every video file — just to render tiles. With files.thumbnails enabled, the
Uploader derives a small JPEG preview from each image or video File and uploads it next
to the original as <remote_path>.thumb.jpg, recording it in that File's status Record
as thumbnail_path (same s3://bucket/key shape as remote_path; the field is simply
absent when there is no preview).
Default is off, and enabling it cannot change what happens to your data:
dc_bridge:
ros__parameters:
files:
thumbnails:
enabled: true
max_dimension: 320 # bound on the preview's longest side, in pixels
ffmpeg_binary: "ffmpeg" # override if it isn't on PATH
A preview is a derived artefact and is treated as strictly secondary to the File it comes from:
- It is generated only after the original is uploaded and verified on that Destination, never before or in parallel.
- Every failure — no
ffmpegonPATH, an undecodable File, a store that rejects the preview — is swallowed. It never fails, delays, retries, or blocks the primary upload; the File uploads exactly as it would with the feature off, and the only visible difference is a missingthumbnail_pathplus a Bridge warning counting how many previews couldn't be generated. - Local previews are scratch files under
<shipper.data_dir>/uploader/thumbs/, removed before the Record finishes processing. So a preview never joins the un-uploaded pool retention measures and can never outlive its original: an intent retention sheds never uploaded, so no preview was ever derived from it. - Remote previews are idempotent by key. A Bridge restart mid-upload replays the intent, finds the preview already on the store, and neither re-decodes nor re-uploads it.
max_dimension bounds the longest side; aspect ratio is preserved and a File already
smaller than the bound is never upscaled. Images become a scaled still; videos become
their first frame. Files that are neither (map YAML, logs) are skipped entirely rather
than handed to a decoder.
The decode dependency: previews are generated by shelling out to the ffmpeg CLI,
the same toolchain files.ffprobe_binary already uses for the duration column — one
tool covering both stills and video first-frames, kept out of dc_uploader's link line,
and crash-isolated in a child process. dc_uploader is built from the dc_bridge
colcon package, and that package's package.xml declares ffmpeg as an exec_depend,
so rosdep install provides it; if it is missing at runtime dc_uploader still uploads
normally and simply produces no previews.
Retention: bounded local storage for un-uploaded Files
The intent queue above never abandons an intent by design — an intent and its Files
live and die together, and deleting the only copy of data as a side effect of queue
management is forbidden. That means a robot offline for weeks, or pointed at a store
that's unreachable for weeks, accumulates un-uploaded Files on disk without bound,
same as Humble did. A full disk takes down more than DC, so files.retention is the
one, explicit, opt-in, audited mechanism allowed to abandon data under disk
pressure — nothing else in the system deletes a File it hasn't verified was uploaded.
Default is off: with files.retention absent (or both limits at their defaults),
behavior is unchanged — accumulation, matching Humble. Configuring it is a deliberate
choice to shed data rather than run out of disk:
dc_bridge:
ros__parameters:
files:
retention:
max_bytes: 10737418240 # cap on the un-uploaded Files pool; 0/absent = unlimited (default)
max_age_days: 30 # optional; whichever limit is hit first
Scope is exactly the pool of Files referenced by intents still pending in
<shipper.data_dir>/queue/upload/ — the same disk-backed queue the durability section
above describes. A File the Uploader has already verified everywhere but is still
waiting to physically delete (files.delete_when_sent, e.g. after a filesystem error)
is never retention's victim; that's delete_when_sent's own retry loop to resolve,
not retention's.
When either limit is exceeded, dc_uploader sheds the oldest eligible intent — its
File(s) and its queue entry, always together, never one without the other — and repeats
until back under both limits. Each shed File gets its own audit row through the normal
dc.files metadata path: deleted: true, uploaded: false is the queryable "shed
without upload" signature, distinct from a normal delete_when_sent deletion (which is
always uploaded: true, since that path only ever deletes a File already confirmed on
every Destination). Emitting the audit row is best-effort — a Shipper outage doesn't
block the shed itself — but every shed always logs a rate-limited warning, since data
was just abandoned without ever leaving the robot.
A Destination named by metadata_destination may declare no inputs at all — being
named there is itself what routes the dc.files Tag to it. That is the usual shape when
the status log lives in its own table: one blessed file Destination (typically anchoring
a passthrough postgres sink, Recipes
above) with inputs for the Records, and a second one with no inputs for the File
status log.
inputs is otherwise mandatory: a Destination that neither lists a topic nor receives
dc.files would have nothing to deliver, and is rejected at Bridge startup.
Raw topic collection
Sometimes the point is not to measure three specific things well, but to capture everything on the ROS graph and put it somewhere — a bring-up session, a field incident, a robot whose interesting topics you don't know yet.
For that, dc_bridge has a generic-subscription mode. It subscribes to topics it
was never compiled against, converts each message to JSON, and ships it to a Destination
like any other Record. No Measurement plugin, no .msg header, no rebuild of DC when
the robot's message packages change.
dc_bridge:
ros__parameters:
shipper:
data_dir: "$HOME/.dc/buffer"
destinations: ["raw_log"]
raw_log:
type: file # blessed types: file | vector — or postgres/s3/console via
# its passthrough recipe (destinations.md#recipes-postgres-s3-console-via-passthrough)
receives: records
path: "/tmp/dc/raw_records.ndjson"
time_key: "date"
raw:
enabled: true
destination: "raw_log"
ros2 launch dc_bringup dc_raw.launch.py
dc_raw.launch.py starts the Bridge alone — no measurement_server, no
group_server, no lifecycle manager, no readiness gate (there are no collection nodes to
gate). The default params file is
dc_bringup/params/dc_raw_params.yaml;
point the launch file at your own with dc_params_file:=…. The same raw: block also
works inside a normal dc_bringup.launch.py params file, next to your Measurements.
How it works
DC uses exactly what ROS 2 offers for this — the same mechanism ros2 bag record -a and
PlotJuggler use:
get_topic_names_and_types()lists the graph. Topics are filtered by the include/exclude patterns below.rclcpp::GenericSubscriptionsubscribes to a topic given only its name and type string, receiving raw serialized bytes.- The type's two type support libraries are loaded at run time —
rosidl_typesupport_cppto deserialize,rosidl_typesupport_introspection_cppto describe the fields — and the message is walked into JSON. - The Record is Tagged
dc.raw.<topic>and routed toraw.destination.
The only requirement is that the message package is on the Bridge's
AMENT_PREFIX_PATH — the same requirement ros2 topic echo has. A type that can't be
resolved is logged once and skipped; the rest of the graph is still collected.
Tags and routing
A raw Record's Tag is the topic name with the leading / dropped and the rest turned
into dots, under the dc.raw. namespace:
| Topic | Tag | Shipper route |
|---|---|---|
/imu | dc.raw.imu | dc.dc.raw |
/robot/battery_state | dc.raw.robot.battery_state | dc.dc.raw |
Unlike a Measurement's Tag, the whole namespace shares one Vector route
(dc.dc.raw), matched with starts_with rather than an exact comparison. That is what
makes discovery possible at all: a rendered Shipper config is fixed when the Bridge
starts, but raw mode mints new Tags whenever a topic appears, and those Records still
have to reach a sink without restarting Vector. A passthrough
sink can consume dc.dc.raw like any other route.
The Tag is carried on the event itself, so a single dump file or table stays
topic-attributable — check the tag field.
What a Record looks like
The JSON mirrors the message structure, field for field: nested messages become nested
objects, arrays and sequences become arrays, string stays a string. A
dc_interfaces/msg/StringStamped on /demo/custom arrives as:
{
"tag": "dc.raw.demo.custom",
"date": "2026-08-12T09:51:33.114777089",
"header": {"frame_id": "base_link", "stamp": {"sec": 1786528293, "nanosec": 114777089}},
"data": "{\"value\": 2}",
"group_key": "demo"
}
Messages that start with a std_msgs/msg/Header are timestamped from
header.stamp — the moment the data was captured. Everything else is stamped with the
Bridge's own clock on arrival.
Type mapping
| ROS field | JSON |
|---|---|
bool | boolean |
int8…int64, uint8…uint64, byte, char | number |
float32, float64 | number |
string | string |
wstring | string (transcoded UTF-16 → UTF-8) |
| a nested message | object |
| any array or sequence (fixed, bounded, unbounded) | array |
Two things about numbers are worth knowing before you point a query at the result:
NaNandInfinityboth becomenull. JSON has neither, so there is nowhere else for them to go — but it means+Inf,-Inf,NaNand "the producer sent nothing" are indistinguishable downstream. This is not a corner case: ROS messages routinely useNaNas a sentinel (sensor_msgs/msg/BatteryState.temperatureisNaNwhen the battery has no temperature sensor), so expect nulls in fields whose message definition documents one.float32is widened to double, so a value written as4.05reads back as4.050000190734863: the exact binary32 value. If the extra digits bother a dashboard, round at the query layer.
A uint8[] serializes as an array of plain numbers — DC does not compress raw payloads on
the way out. That is one more reason the size and type limits below exist: the answer to a
megabyte of image bytes is to not collect it, rather than to encode it more cleverly.
Choosing what to collect
raw:
include: ["^/"] # topic-name regexes: the allowlist
exclude: ["^/rosout$", "^/parameter_events$", "^/dc/measurement/", "^/dc/group/"]
exclude_types: # message-type regexes
- "^sensor_msgs/msg/(Image|CompressedImage|PointCloud|PointCloud2|LaserScan)$"
- "^tf2_msgs/msg/TFMessage$"
rescan_interval_secs: 5.0
A topic is collected when it matches at least one include pattern, no exclude
pattern, and its type matches no exclude_types pattern. All three are ECMAScript
regexes matched with regex_search, so they are unanchored unless you anchor them:
camera matches /front/camera/info, ^/front/ matches only that namespace.
The values above are the defaults, and they matter:
/rosoutis excluded — it carries the Bridge's own log messages, including the warnings raw mode emits about volume./dc/measurement/*and/dc/group/*are excluded — those topics already reach their Destinations as Measurement and Group Records. Collecting them raw as well ships everything twice, under two different Tags.- High-rate sensor types are excluded, by type rather than by name (a camera topic is
not reliably called anything in particular). One 640×480
sensor_msgs/msg/Imageis 900 kB on the wire and roughly 3.7 MB once every pixel byte is a JSON number; at 30 Hz nothing downstream is sized for it. Override the list deliberately if you want them — DC will not stop you, but read the next section first.
To replace a list, write the replacement; note that an empty YAML list ([]) cannot be
loaded by rclcpp (it has no inferable element type), so use a pattern that matches
nothing, e.g. ["^$"], to disable a default.
rescan_interval_secs re-scans the graph so topics that appear after startup are picked
up — a driver started later, a node that respawned. The cost is that a topic is collected
only from ~one interval after it is first advertised: messages published before that are
not captured. Set it to 0 to scan once at startup and never again.
Topics advertising more than one type are skipped and logged: one subscription carries one type, and picking arbitrarily would silently drop the other publisher's messages.
QoS is matched to the topic's current publishers, the same way ros2 bag record does
it — best effort if any publisher is best effort, transient local if all of them are.
Without that, a generic subscription silently receives nothing from a sensor driver.
Backpressure and volume
Collecting everything can outrun the Shipper trivially. Raw mode's contract is that it sheds at the source rather than buffering inside the Bridge — an unbounded in-process queue would just move a data problem into a memory problem. Four bounds, in the order a message meets them:
qos_depth(default 10) — the subscription's own history. If the Bridge is momentarily busy, the middleware drops the oldest messages beyond this depth before DC ever sees them.max_message_size_bytes(default 1 MiB, 0 = unlimited) — a serialized message above this is dropped whole, before deserialization, so an unexpected point cloud costs nothing but a throttled warning. This is a per-message circuit breaker — see the warning below.max_rate_hz(default 10, per topic, 0 = unlimited) — at most one Record per1/rateseconds per topic: a message passes once that long has elapsed since the last one that passed, so each Record is the newest message at the moment it is emitted and nothing is held back. A 200 Hz topic at the default becomes 10 Hz of Records. This is decimation: it flattens exactly the bursty traffic shape a token bucket would let through all at once.- The Shipper refusing the Record — if Vector is unreachable or its socket is blocked past the Forwarder's write timeout, the raw Record is dropped and counted. Measurement Records are kept in the Forwarder's unacked window for resend; raw Records are not, because a firehose fills that window and pushes real Records out of it.
Everything past those bounds behaves like any other Record: Vector's disk buffer
(shipper.buffer_max_bytes) absorbs a Destination outage, and delivery to the Shipper is
acknowledged (see Destinations).
How much data is this?
These figures were measured on a simulated robot:
tools/sim/scripts/measure_raw_volume.sh boots dc_simulation's warehouse world, drives
the TurtleBot3-Waffle in a slow circle, points a Bridge in raw mode at its live topics,
and reports what a file Destination stored, per Tag. Everything below is one run of it —
re-run it after anything that changes what a Record costs. It's meant for manual local
runs; its header explains the three configurations and why its rates are counted in
simulated seconds.
Rates are that world's Waffle's: IMU 200 Hz, odometry and TF 30 Hz (the DiffDrive
plugin), lidar and both RGBD cameras 5 Hz. /cmd_vel and /clock are left out — the
first is the benchmark's own driving, the second exists only because the robot is
simulated.
| Configuration | Shipped |
|---|---|
| Defaults (10 Hz cap, sensor types excluded) | 24 kB/s — 86 MB/hour, 2.1 GB/day |
…plus scan and tf re-enabled | 69 kB/s — 5.9 GB/day |
| …plus both 1280×720 cameras re-enabled | ≈ 9.5 TB/day, if anything could carry it |
Per-Record cost, which is what to multiply by your own topics' rates:
| Topic (message) | Publishes at | Bytes per Record |
|---|---|---|
/joint_states (JointState, 2 joints) | 1 000 Hz † | 355 |
/tf (TFMessage, 1 transform) | 30 Hz | 406 |
…/camera_info (CameraInfo) | 5 Hz | 581 |
/odom (Odometry) | 30 Hz | 669 |
/imu (Imu) | 200 Hz | 767 |
/scan (LaserScan, 360 ranges + intensities) | 5 Hz | 7 878 |
…/image_raw (Image, 1280×720 rgb8) | 5 Hz | 10 981 032 |
† the simulator's JointStatePublisher runs every physics step; a real driver is far
slower. It makes no difference to the total, which is the point of the next paragraph.
The rate cap is what makes the first row affordable. A topic
publishing faster than max_rate_hz contributes bytes_per_record × 10 per second no
matter how fast it actually runs, so joint_states at 1 000 Hz and imu at 200 Hz cost
3.6 kB/s and 7.7 kB/s respectively. Only the topics below the cap — the 5 Hz sensors —
bill at their real rate, which is why re-enabling one 5 Hz lidar (7.9 kB per Record, 40
kB/s, 3.5 GB/day) nearly triples the total on its own.
The last row is the whole argument for the default type exclusions: one 1280×720 frame
costs as much as ~16 000 odometry Records. JSON does not merely double a byte array —
10 981 032 bytes for a 2 764 800-byte frame is four times the wire size, because
most pixel values print as three digits and a comma.
Two cameras at 5 Hz is 110 MB/s of Records, and nothing in the pipeline carries that,
which is why that row says "if anything could carry it": in the run it comes from, the
Shipper refused 475 of the 894 Records offered to it (dropped … 475 shipper, 53 %). The
collapse was not confined to the images either — imu arrived at 4 Hz instead of 200 and
odom at 0.7 Hz instead of 30, because the Bridge spent the window serializing frames.
Collecting a camera raw does not cost you a camera's worth of storage; it costs you the
rest of your collection.
The size cap will not save you from a camera — and it should not be asked to. A
640×480 rgb8 frame is 921 600 bytes on the wire, under the default
max_message_size_bytes of 1 MiB, so it passes the size gate and lands as megabytes of
JSON. (This world's 1280×720 frames are three times that and the default cap does drop
them whole — which is why the benchmark's camera profile has to lift it to measure
anything at all. Relying on that is a collection policy that silently switches on the day
someone fits a smaller sensor.) It is exclude_types that keeps images out, and removing
that list removes the protection entirely.
The tempting fix — lower the size cap until frames stop fitting — is a bad trade, because the two limits fail differently:
max_rate_hzdrops by time, uniformly. Every window is still represented, so you get an honest lower-resolution time series.max_message_size_bytesdrops by content. On any topic whose messages vary in size — a compressed image, a point cloud that grows with scene complexity, a diagnostics array, a string payload — it removes precisely the large ones and keeps the small ones. The result looks complete and is silently biased toward the least interesting data, with nothing in the stored Records to say what went missing.
So set the size cap high enough that it essentially never fires, and treat it as a circuit breaker against the pathological and unanticipated (the topic you did not know carried 100 MB). To not collect something, exclude it by type or topic: all-or-nothing, visible in the startup log, and no biased sample. The only case for a low size cap is when you genuinely want "this topic, except its outliers" — which is rarely what anyone means.
Every drop is counted, and the counters are on the Bridge's readiness service — the fastest way to answer "is raw mode shedding?":
$ ros2 service call /dc_bridge/ready std_srvs/srv/Trigger
response: success=True, message='vector is accepting connections | raw: 12 topic(s),
3480 forwarded, dropped 51200 rate / 0 oversize / 0 shipper / 0 undecodable'
dropped rate climbing is normal and healthy (it is the limiter doing its job).
dropped shipper climbing means the pipeline is genuinely behind: raise
shipper.buffer_max_bytes, lower max_rate_hz, or narrow include.
When not to use it
Raw mode ships whatever a topic happens to contain. It has no Conditions, no data validation, no Groups, and no File uploads — a Measurement is still the right tool for data you know you want, in a shape you control, joined with other data. Raw mode is for the case where you don't know yet, or where "all of it" is the requirement.
It is also not a rosbag replacement: JSON in Postgres is not a replayable recording. If
you want replay, point a passthrough sink at the
dc.dc.raw route and let dc_mcap_writer record it, or run ros2 bag record alongside
DC.
KPI views
DC collects Records; the numbers an operations team reports on are computed from those Records in SQL, on the database, never on the robot. The window is a query parameter, so changing a KPI definition is re-applying one file — not redeploying a fleet.
The set covers availability and uptime, utilisation, intervention rate,
MTBF/MTTR and loop closure rate. It lives in tools/infrastructure/sql/kpi_views.sql
and reads the dc table the PostgreSQL Destination
writes into.
What it defines
| Object | Kind | Reports |
|---|---|---|
dc_kpi_uptime_samples | view | One row per uptime Record: robot_name, sample_time, uptime_seconds, run_id, prev_sample_time |
dc_kpi_availability(from, to [, max_gap]) | function | Per robot: samples, first_sample, last_sample, uptime_seconds, covered_seconds, window_seconds, availability |
dc_kpi_availability_5m | view | The same metric in 5-minute buckets, for charting — filter on bucket_start |
dc_kpi_driving_samples | view | One row per driving_type Record: robot_name, sample_time, mode, prev_sample_time, and the speed last reported at or before it |
dc_kpi_utilisation(from, to [, max_gap [, min_speed]]) | function | Per robot: samples, speed_samples, reported_seconds, autonomous_seconds, manual_seconds, teleop_seconds, unknown_seconds, productive_seconds, window_seconds, utilisation |
dc_kpi_utilisation_5m | view | Utilisation in 5-minute buckets |
dc_kpi_intervention_events | view | One row per intervention Record, with is_start/is_end derived from the modes it names |
dc_kpi_intervention_rate(from, to [, max_gap]) | function | Per robot: interventions, open_interventions, ended_interventions, autonomous_seconds, distance_km, per_autonomous_hour, per_km, mean_intervention_seconds, total_intervention_seconds |
dc_kpi_interventions_1h | view | Interventions in 1-hour buckets |
dc_kpi_fault_events | view | One row per fault Record: component, from_level, to_level, previous_duration, sequence, reason, open |
dc_kpi_reliability(from, to [, failure_levels]) | function | Per component: failures, repairs, open_faults, operating_seconds, downtime_seconds, mtbf_seconds, mttr_seconds |
dc_kpi_faults_1h | view | Failures, repairs and downtime in 1-hour buckets |
dc_kpi_loop_closure_events | view | One row per slam_toolbox_quality loop_closure Record (#394) |
dc_kpi_loop_closure_rate(from, to) | function | Per robot: loop_closures, window_seconds, per_hour, last_loop_closure, seconds_since_last |
dc_kpi_loop_closures_1h | view | Loop closures in 1-hour buckets |
dc_kpi_max_gap() | function | The grace period every definition above shares (30 s) |
dc_kpi_min_speed() | function | The speed at or above which the robot counts as moving (0.05 m/s) |
dc_kpi_failure_levels() | function | The diagnostic levels that count as broken (ERROR, STALE) |
-- Every metric for the last 24 hours, per robot.
SELECT * FROM dc_kpi_availability(now() - INTERVAL '24 hours', now());
SELECT * FROM dc_kpi_utilisation(now() - INTERVAL '24 hours', now());
SELECT * FROM dc_kpi_intervention_rate(now() - INTERVAL '24 hours', now());
SELECT * FROM dc_kpi_reliability(now() - INTERVAL '24 hours', now());
-- Any of them as a chart series.
SELECT bucket_start, robot_name, availability FROM dc_kpi_availability_5m
WHERE bucket_start >= now() - INTERVAL '24 hours' ORDER BY 1;
Availability and uptime
Reads the uptime Measurement. Each uptime Record vouches for the time back to the previous one, capped at the grace period and clipped to the window. A robot polling uptime every 5 s therefore reports 100 % availability, and only a silence longer than the grace period costs anything: a 5-minute outage in a 15-minute window leaves 630 of 900 seconds covered, so 70 %.
Consequences worth knowing before you put the number on a report:
- Availability is reported availability. It answers "was the robot up and shipping data", which is what an operations team can act on — not "was the robot doing useful work".
- A window longer than DC has been running reads low, because the time before the first Record is genuinely unreported.
- A robot whose Records stopped before the window starts drops out of the result entirely rather than reporting 0 %: nothing in the database distinguishes it from a robot that was never deployed. A fleet registry is what would fix that, and DC has none.
Utilisation
Reads the driving_type and speed Measurements. Time is credited exactly the way availability credits it — back to the previous driving_type Record, capped at the grace period, clipped to the window — and attributed to the mode of the Record that closes the interval. Of that reported time, the share spent moving under a known mode is productive:
utilisation = productive_seconds / reported_seconds
manual and teleop count as productive: a human driving the robot is still the robot
being used. Only unknown — no command source has published within velocity_timeout_s,
or no mode has ever been observed — does not.
What it deliberately does not claim:
- Not "useful work". A robot standing still while it inspects something reads as idle, and a robot driving in circles reads as productive. Distinguishing the two needs the Mission Measurement, which does not exist yet (see below).
- No speed Record in the window means
utilisationis NULL. A deployment that collectsdriving_typebut notspeedhas unreported movement rather than zero movement.speed_samplesis in the output so a NULL can be told from an empty range. - A speed Record vouches for the grace period after it, no longer. Movement reported once and then never again buys only 30 seconds of productive time, however long the window actually runs.
- The per-mode seconds add up to
reported_seconds, so the ratio can always be checked against its parts.
Intervention rate
Reads the intervention Measurement (#362) for the numerator and driving_type plus
distance_traveled for the denominators. An
intervention starts when a Record leaves autonomous for manual or teleop, and ends
when one returns to autonomous; the end Record's previous_duration is the takeover's own
length.
per_autonomous_hour = interventions / (autonomous_seconds / 3600)
per_km = interventions / distance_km
Two denominators rather than one because they fail differently: a robot that spends a shift parked has few autonomous hours and no kilometres, and a robot doing tight manoeuvring has plenty of hours and few kilometres. Reporting both makes the difference visible instead of picking a winner.
What it deliberately does not claim:
- A denominator nothing reported gives a NULL rate. A robot with
no
driving_typeRecords hasautonomous_secondsNULL andper_autonomous_hourNULL; the same holds fordistance_traveledandper_km. - A takeover still running is counted but never timed. Only an end Record carries a
duration, so an open interval is absent from
mean_intervention_secondsandtotal_intervention_secondsrather than a zero in them.open_interventionscounts the Records the Measurement flagged open. - A takeover that starts before the window or ends after it is counted in the window its Record falls in. The window selects events, not intervals.
MTBF and MTTR
Reads the fault Measurement (#365). A raise is a Record entering a failure level
from a healthy one; a clear is one leaving a failure level for a healthy one. Both carry
previous_duration — how long the level just left was held — which is what the two averages
are averages of:
mtbf_seconds = mean healthy time preceding a raise
mttr_seconds = mean time in a failure level preceding a clear
Failure levels default to ERROR and STALE and are a query parameter:
dc_kpi_reliability(from, to, ARRAY['ERROR']) treats a silent component as reportable but
not broken. WARN is not a failure by default, so OK → WARN → ERROR is one failure, timed
from the last healthy state.
What it deliberately does not claim:
- A change inside the failure set is not a second failure.
ERROR → STALEis neither a raise nor a clear: a component that goes quiet while already broken is still one fault. - A fault never cleared has no repair time. It counts in
failuresandopen_faults, and is absent frommttr_secondsrather than averaged in as an instant repair. - Grouped by component, never rolled up per robot. "The robot is down" is a policy over components that nothing here knows, and averaging independent components together reports a number for a failure mode no component has.
- The durations come from the Records, so they can reach outside the window. A failure after eight healthy hours reports eight hours of MTBF in a one-hour window; the window chooses which events count, not how long their intervals were.
Loop closure rate
Reads the slam_toolbox_quality Measurement (#394). slam_toolbox/LoopClosureEvent carries
nothing but its own occurrence, so the KPI value is entirely in Record timing:
per_hour = loop_closures / (window_seconds / 3600)
alongside seconds_since_last — how long it's been since the most recent loop closure as of
window_end, a localization-drift risk indicator distinct from the rate: a robot can have a
healthy rate over a long window and still be mid-drift right now if its last correction was a
while ago.
What it deliberately does not claim:
seconds_since_lastlooks pastwindow_start. Clipped to the window it would read a robot with no loop closure yet in a short window as "just corrected" instead of "never corrected" — the other rate functions clip strictly to the window, this one deliberately doesn't, for this one column.- A robot with no loop closure Record at all, ever, is absent from the result — same as every other rate function here: nothing distinguishes "never ran slam_toolbox" from "ran it and never closed a loop" without a fleet registry.
Mission success rate is not here yet
The fourth starter metric — completed, failed, cancelled and aborted missions as a share of
missions started — has no KPI view yet, but the design decision that used to block it
(#305) is resolved: Mission (Nav2 NavigateToPose),
Mission (Nav2 FollowWaypoints), Mission
(Nav2 NavigateThroughPoses) and Mission
(Open-RMF) are all implemented Measurements today,
emitting outcome Records DC already collects. Writing the dc_kpi_mission_* view/function
pair on top of that data — the same shape as every other metric on this page — is what's
still open; the source data it would read from already exists.
What the data has to look like
The views read the dc table's columns directly, so the robot's configuration has to fill
them:
- every Measurement the views read runs with
include_measurement_name: true—nameis what tells one Measurement's Records apart from another's; robot_nameis set, throughcustom_keys_str— Records without it are grouped underunknown;- the
postgresDestination writes to thedctable withtime_key: "date", whose default format is epoch nanoseconds.
| Metric | Measurements it needs |
|---|---|
| Availability | uptime |
| Utilisation | driving_type, speed |
| Intervention rate | intervention (#362), driving_type, distance_traveled |
| MTBF / MTTR | fault (#365) |
| Loop closure rate | slam_toolbox_quality (#394) |
dc_demos/params/tb3_simulation_pgsql_minio.yaml is a working example of the
uptime/driving_type/speed/distance_traveled set. intervention and fault
(#362, #365) are implemented Measurements too, but no shipped demo params file
configures either yet — their views return no rows until a deployment enables them. The
columns they write into are already in
tools/infrastructure/docker/config/postgresql/init.sql, since Vector's postgres sink
maps a Record's keys onto existing columns and silently drops the rest.
In the demo
tools/infrastructure/docker/docker-compose.postgresql.yaml mounts the tables and the KPI
definitions into PostgreSQL's init directory, so
bringing PostgreSQL up applies both. Grafana's
provisioning ships a ROS 2 Data Collection - KPI dashboard reading them. Start the demo,
open http://localhost:3000 (admin/admin), and the availability and
utilisation panels populate as Records arrive; nothing has to be imported by hand.
The demo runs driving_type off Nav2's /cmd_vel, which is the only command source the
simulation has: the mode is autonomous while Nav2 publishes and unknown otherwise. A
real deployment adds its teleop topic to velocity_topics — that is also what makes an
intervention distinguishable from an idle robot.
PostgreSQL runs its init directory only on an empty data directory. A database container that already existed before this file did needs the views applied explicitly — that is what the script below is for.
Pointing the views at a real deployment
The definitions have nothing demo-specific in them. Apply them to any PostgreSQL that holds DC Records:
PGPASSWORD=... ./tools/infrastructure/scripts/apply_kpi_views.bash \
--host=db.example.com \
--port=5432 \
--user=dc \
--database=dc
The script uses psql when it is installed and a postgres container otherwise. Every
object is CREATE OR REPLACE, so re-running it is how a changed definition ships — no robot
is touched, and the next dashboard refresh picks up the new numbers.
Then, on the reporting side:
-
Grafana: point the PostgreSQL datasource at the deployment (
tools/infrastructure/docker/config/grafana/provisioning/grafana-datasource.yml, uiddc_postgres) and the dashboard follows, since every panel queries by name. Grafana that isn't provisioned from this repo can importtools/infrastructure/docker/config/grafana/dashboards/kpi.jsoninstead. -
A read-only dashboard user needs no more than:
GRANT SELECT ON dc_kpi_uptime_samples, dc_kpi_availability_5m, dc_kpi_driving_samples, dc_kpi_utilisation_5m, dc_kpi_intervention_events, dc_kpi_interventions_1h, dc_kpi_fault_events, dc_kpi_faults_1h, dc_kpi_loop_closure_events, dc_kpi_loop_closures_1h TO grafana; GRANT EXECUTE ON FUNCTION dc_kpi_availability(timestamptz, timestamptz, interval), dc_kpi_utilisation(timestamptz, timestamptz, interval, double precision), dc_kpi_intervention_rate(timestamptz, timestamptz, interval), dc_kpi_reliability(timestamptz, timestamptz, text[]), dc_kpi_loop_closure_rate(timestamptz, timestamptz) TO grafana; -
Records stored elsewhere — another schema, another table name — only affect the four sample/event views: they are the only objects that name the
dctable, and everything else is defined on top of them.
Testing a change
The fixture test seeds PostgreSQL with a known Record sequence and asserts what the definitions report over it, including the outage, open-interval and missing-denominator cases that are awkward to reproduce by hand:
./tools/infrastructure/scripts/test_kpi_views.sh
It brings up a throwaway PostgreSQL with Podman, applies these same SQL files into a schema
of its own, and runs tools/infrastructure/test. The intervention and fault cases seed the
Records their Measurements will emit, so a definition change breaks a test here rather than
a dashboard later. Add a case for every definition you add.
Configuration examples
Through minimal code examples, you will learn how to collect and send data with DC.
It will progressively present all features.
By here, you must have built the workspace following the setup guide.
Copy the configuration and save it as a yaml file, and then run:
ros2 launch dc_bringup dc_bringup.launch.py params_file:="my_file.yaml"
Examples that use a Group also need the Group node:
ros2 launch dc_bringup dc_bringup.launch.py params_file:="my_file.yaml" group_node:=True
Every example follows the same shape: a dc_bridge block declaring Destinations and
the topics each one inputs, and a measurement_server block declaring Measurements
and the topic each one publishes on. Routing is the overlap between the two lists —
nothing on the Measurement side names a Destination.
```admonish info title="Why file + a passthrough snippet, not a blessed console Destination"
Every "to the console" example below prints through a passthrough console sink loaded
via custom_config_files, not a blessed console Destination — per
ADR-0003, console (along with
postgres and s3) moved from the blessed ROS-param form to a passthrough recipe (#471),
being a pure Vector-sink wrapper with no DC-specific logic. destinations still names a
file Destination in each example: dc_bridge derives its ROS subscriptions and
dc.<tag> routes from destinations alone, never from a passthrough snippet's inputs,
so a cheap file anchor is what actually creates the route the snippet consumes. See
Destinations: Recipes for
the recipe this reuses throughout, and Passthrough
for the underlying mechanism.
Save this once as ~/.dc/console_sink.toml, and update its inputs to match whichever
example you're running (each example below says what to set it to):
[sinks.debug_console]
type = "console"
inputs = ["dc.dc.measurement.uptime"] # <- change this to match the example
target = "stdout"
[sinks.debug_console.encoding]
codec = "json"
## Running the examples
### Example 1: Uptime to the console every second
`console_sink.toml`'s `inputs`: `["dc.dc.measurement.uptime"]` (the default above).
```yaml
dc_bridge: # Bridge (Shipper) node configuration
ros__parameters:
destinations: ["records_log"] # List of Destination names to enable
records_log: # Destination name, you choose
type: file # Blessed Destination type -- the passthrough's anchor
receives: records
inputs: ["/dc/measurement/uptime"] # Same as topic_output in the uptime measurement in measurement_server
path: "/tmp/dc/example1_records.ndjson"
custom_config_files: ["$HOME/.dc/console_sink.toml"]
measurement_server: # Measurement node configuration
ros__parameters:
measurement_plugins: ["uptime"] # List of measurement plugins names to enable
uptime: # Plugin name, you choose
plugin: "dc_measurements/Uptime" # Plugin class name, fixed
topic_output: "/dc/measurement/uptime" # Topic where data will be published
Example 2: Uptime to the console with ISO 8601 timestamps
console_sink.toml's inputs: ["dc.dc.measurement.uptime"] (unchanged from Example 1).
dc_bridge:
ros__parameters:
destinations: ["records_log"]
records_log:
type: file
receives: records
inputs: ["/dc/measurement/uptime"]
path: "/tmp/dc/example2_records.ndjson"
time_key: "date" # Field the normalized timestamp is written to
time_format: "iso8601" # "epoch_nanos" (default) | "iso8601" | "double"
custom_config_files: ["$HOME/.dc/console_sink.toml"]
measurement_server:
ros__parameters:
measurement_plugins: ["uptime"]
uptime:
plugin: "dc_measurements/Uptime"
topic_output: "/dc/measurement/uptime"
Example 3: Uptime to the console only at start and 3 times
console_sink.toml's inputs: ["dc.dc.measurement.uptime"] (unchanged from Example 1).
dc_bridge:
ros__parameters:
destinations: ["records_log"]
records_log:
type: file
receives: records
inputs: ["/dc/measurement/uptime"]
path: "/tmp/dc/example3_records.ndjson"
custom_config_files: ["$HOME/.dc/console_sink.toml"]
measurement_server:
ros__parameters:
measurement_plugins: ["uptime"]
uptime:
plugin: "dc_measurements/Uptime"
topic_output: "/dc/measurement/uptime"
init_max_measurements: 3 # Maximum records to collect
Example 4: CPU and Memory to the console every 5 seconds forever
console_sink.toml's inputs: ["dc.dc.measurement.cpu", "dc.dc.measurement.memory"].
dc_bridge:
ros__parameters:
destinations: ["records_log"]
records_log:
type: file
receives: records
inputs: ["/dc/measurement/cpu", "/dc/measurement/memory"]
path: "/tmp/dc/example4_records.ndjson"
custom_config_files: ["$HOME/.dc/console_sink.toml"]
measurement_server:
ros__parameters:
measurement_plugins: ["memory", "cpu"]
memory:
plugin: "dc_measurements/Memory"
topic_output: "/dc/measurement/memory"
polling_interval: 5000 # Interval to which data is collected in milliseconds
cpu:
plugin: "dc_measurements/Cpu"
topic_output: "/dc/measurement/cpu"
polling_interval: 5000 # Interval to which data is collected in milliseconds
Example 5: CPU and Memory as a group to the console every 5 seconds forever
console_sink.toml's inputs: ["dc.dc.group.cpu_memory"].
dc_bridge:
ros__parameters:
destinations: ["records_log"]
records_log:
type: file
receives: records
inputs: ["/dc/group/cpu_memory"] # Group to create
path: "/tmp/dc/example5_records.ndjson"
custom_config_files: ["$HOME/.dc/console_sink.toml"]
group_server: # Group server configuration
ros__parameters:
groups: ["cpu_memory"]
cpu_memory:
inputs: ["/dc/measurement/cpu", "/dc/measurement/memory"] # Topics which are subscribed
output: "/dc/group/cpu_memory" # Topic where result will be published
sync_delay: 5.0 # How long to queue up messages before passing them through.
group_key: "cpu_memory"
measurement_server:
ros__parameters:
measurement_plugins: ["memory", "cpu"]
memory:
plugin: "dc_measurements/Memory"
topic_output: "/dc/measurement/memory"
polling_interval: 5000
cpu:
plugin: "dc_measurements/Cpu"
topic_output: "/dc/measurement/cpu"
polling_interval: 5000
Example 6: Custom ROS message to the console every 2 seconds forever
console_sink.toml's inputs: ["dc.dc.measurement.my_string_stamped"].
dc_bridge:
ros__parameters:
destinations: ["records_log"]
records_log:
type: file
receives: records
inputs: ["/dc/measurement/my_string_stamped"]
path: "/tmp/dc/example6_records.ndjson"
custom_config_files: ["$HOME/.dc/console_sink.toml"]
measurement_server:
ros__parameters:
measurement_plugins: ["my_string_stamped"]
my_string_stamped:
plugin: "dc_measurements/StringStamped" # Plugin that allow to publish from your nodes
topic_output: "/dc/measurement/my_string_stamped" # Topic where the Record is republished
topic: "/hello-world" # Input topic where you are publishing
polling_interval: 2000
enable_validator: false # By default, StringStamped message does not have a JSON schema since it uses custom input data
You will then need in another terminal to publish data on the input topic (/hello-world)
ros2 topic pub -r 1 /hello-world dc_interfaces/msg/StringStamped "{data: '{\"hello\":\"world\"}'}"
Example 7: Custom ROS message to the console every time it is published
console_sink.toml's inputs: ["dc.dc.measurement.my_string_stamped"] (unchanged from Example 6).
dc_bridge:
ros__parameters:
destinations: ["records_log"]
records_log:
type: file
receives: records
inputs: ["/dc/measurement/my_string_stamped"]
path: "/tmp/dc/example7_records.ndjson"
custom_config_files: ["$HOME/.dc/console_sink.toml"]
measurement_server:
ros__parameters:
measurement_plugins: ["my_string_stamped"]
my_string_stamped:
plugin: "dc_measurements/StringStamped"
topic_output: "/dc/measurement/my_string_stamped"
topic: "/hello-world"
enable_validator: false
timer_based: false # Get all data published on the input topic. Ignores polling_interval
Example 8: Uptime to PostgreSQL, and to the console at the same time
A Record is delivered to every Vector sink that consumes its route — listing the same
dc.<tag> route in two sinks' inputs is how you fan out. Both PostgreSQL and console are
reached through the passthrough here (per ADR-0003,
neither is a blessed Destination any more — see
Destinations: Recipes); a
single file anchor creates the one route both passthrough sinks consume.
dc_bridge:
ros__parameters:
shipper:
data_dir: "$HOME/.dc/buffer" # Where the Shipper keeps its disk buffer
destinations: ["records_log"]
records_log:
type: file
receives: records
inputs: ["/dc/measurement/uptime"]
path: "/tmp/dc/example8_records.ndjson"
custom_config_files: ["$HOME/.dc/example8_sink.toml"]
measurement_server:
ros__parameters:
measurement_plugins: ["uptime"]
uptime:
plugin: "dc_measurements/Uptime"
topic_output: "/dc/measurement/uptime"
# ~/.dc/example8_sink.toml
[sinks.pgsql]
type = "postgres"
inputs = ["dc.dc.measurement.uptime"]
endpoint = "postgres://dc:$DC_PG_PASSWORD@127.0.0.1:5432/dc" # user:password@host:port/database
table = "dc"
[sinks.pgsql.buffer]
type = "disk"
max_size = 268435488
[sinks.debug_console]
type = "console"
inputs = ["dc.dc.measurement.uptime"]
target = "stdout"
[sinks.debug_console.encoding]
codec = "json"
Vector's postgres sink maps a Record's top-level JSON keys onto existing
columns; it does not create tables or columns. Create the table before starting DC.
Unlike the blessed form's password, the $DC_PG_PASSWORD above is Vector's own
${VAR} interpolation, off by default in the vendored Vector binary dc_bridge spawns
— see the warning in Destinations: Recipes.
Example 9: Camera images to object storage, with their metadata in PostgreSQL
Files (images, maps, videos) never travel through the Shipper. A receives: files
Destination is served by dc_uploader, a separate process with its own Shipper
connection (ADR-0014), and the
per-File status Records it produces go to whichever Destination
files.metadata_destination names. dc_uploader's durable upload intent queue and
multipart-resume state live under uploader.data_dir,
separate from the Shipper's own disk buffer under shipper.data_dir — set both, as below,
so it's obvious on disk (and later in volume mounts) which files belong to which owner.
If uploader.data_dir is omitted it defaults to shipper.data_dir, so existing configs
that only set the latter keep working unchanged.
dc_bridge:
ros__parameters:
shipper:
data_dir: "$HOME/.dc/shipper"
uploader:
data_dir: "$HOME/.dc/uploader"
destinations: ["records_log", "rustfs"]
records_log: # anchor for the Records, and for the File status log
type: file
receives: records
inputs: ["/dc/measurement/camera"]
path: "/tmp/dc/example9_records.ndjson"
rustfs: # the File bytes
type: s3
receives: files
inputs: ["/dc/measurement/camera"]
bucket: "dc-files"
endpoint: "http://127.0.0.1:9000" # omit for AWS S3
region: "us-east-1"
access_key_id: "rustfsadmin"
secret_access_key: "$DC_S3_SECRET"
force_path_style: true # path-style addressing for self-hosted stores
files:
delete_when_sent: true # delete locally once verified remotely
metadata_destination: "records_log" # must name a `receives: records` Destination -- a passthrough sink id isn't eligible
custom_config_files: ["$HOME/.dc/example9_sink.toml"]
measurement_server:
ros__parameters:
measurement_plugins: ["camera"]
camera:
plugin: "dc_measurements/Camera"
topic_output: "/dc/measurement/camera"
cam_topic: "/camera/image_raw"
cam_name: "camera"
save_detections_img: true
save_inspected_path: "camera/inspected/%Y-%m-%dT%H-%M-%S"
detection_modules: ["barcode"]
remote_keys: ["rustfs"] # must equal the receives: files Destination name
remote_prefixes: [""]
# ~/.dc/example9_sink.toml -- consumes both routes records_log creates: the camera
# measurement's own topic, and the dc.files Tag it gains from being named as
# files.metadata_destination.
[sinks.pgsql]
type = "postgres"
inputs = ["dc.dc.measurement.camera", "dc.dc.files"]
endpoint = "postgres://dc:$DC_PG_PASSWORD@127.0.0.1:5432/dc"
table = "dc"
[sinks.pgsql.buffer]
type = "disk"
max_size = 268435488
rustfs stays a blessed Destination: receives: files is served entirely by
dc_uploader reading these same ROS params, never by a Vector sink, so there is no
passthrough equivalent for it to migrate to (see
Destinations: Recipes).
Example 10: A Destination DC does not bless, via the passthrough
Any sink in Vector's catalog is
reachable by handing raw Shipper configuration through, consuming the public dc.<tag>
route for the topic you want.
dc_bridge:
ros__parameters:
shipper:
data_dir: "$HOME/.dc/buffer"
destinations: ["records_log"]
records_log:
type: file
receives: records
inputs: ["/dc/measurement/uptime"]
path: "/tmp/dc/example10_records.ndjson"
custom_config_files: ["$HOME/.dc/http_sink.toml"]
measurement_server:
ros__parameters:
measurement_plugins: ["uptime"]
uptime:
plugin: "dc_measurements/Uptime"
topic_output: "/dc/measurement/uptime"
# $HOME/.dc/http_sink.toml — raw Vector configuration, merged as-is
[sinks.my_api]
type = "http"
inputs = ["dc.dc.measurement.uptime"] # /dc/measurement/uptime's public route
uri = "http://127.0.0.1:8080/ingest"
encoding.codec = "json"
Now that you know how it works, you can set up your own Measurements and Destinations — see Measurements and Destinations for every parameter.
Infrastructure setup
DC delivers Records and Files to systems you run yourself. These pages cover bringing up the ones the demos and examples assume:
| Page | Used as |
|---|---|
| Adminer | A database GUI for browsing the PostgreSQL Records and File status log |
| PostgreSQL | A postgres Destination, and the File status log |
| RustFS | An s3 Destination, for Records and for File uploads |
| Grafana | Dashboards over the PostgreSQL Records and the KPI views |
| Elasticsearch | A passthrough Destination (elasticsearch), + Kibana |
| InfluxDB | A passthrough Destination (influxdb_logs) |
| IP camera | An RTSP source for the IP camera Measurement |
The compose files live in tools/infrastructure/docker/. None of this is required to run
DC — the console and file Destinations need nothing external.
Adminer
Description
Adminer (formerly phpMinAdmin) is a full-featured database management tool written in PHP. Conversely to phpMyAdmin, it consist of a single file ready to deploy to the target server. Adminer is available for MySQL, MariaDB, PostgreSQL, SQLite, MS SQL, Oracle, Elasticsearch, MongoDB and others via plugin
Start in a container
Execute:
./tools/infrastructure/scripts/install_infrastructure.bash \
--tool=adminer \
--install-type=docker
Start natively
./tools/infrastructure/scripts/install_infrastructure.bash \
--tool=adminer \
--install-type=native
Credentials
| Type | User | Password | Database | Port |
|---|---|---|---|---|
| PostgreSQL (Native) | dc | password | dc | 80 |
| PostgreSQL (Container) | dc | password | dc | 8080 |
How to use
Natively, by accessing http://localhost:80/adminer, and in a container, by accessing http://localhost:8080, you will be able to see this page:
Elasticsearch
Description
Elasticsearch is a distributed, JSON-native search
and analytics engine. It stores Records as documents — no schema to declare up front, no
columns to pre-create — which makes it a natural fit for the passthrough
Destination: dc_bridge has no
type: elasticsearch, and none is needed, because Vector ships an
elasticsearch sink that speaks the bulk API directly.
Kibana is Elasticsearch's own query and dashboard UI, and is what the Elasticsearch tutorial uses to look at what landed.
Start in a container
Execute:
./tools/infrastructure/scripts/install_infrastructure.bash \
--tool=elasticsearch \
--install-type=docker
or, driving the compose file directly with Podman (the engine the rest of this repo's container tooling uses):
podman compose -f tools/infrastructure/docker/docker-compose.elasticsearch.yaml up -d
This starts a single-node Elasticsearch plus a Kibana pointed at it. Elasticsearch has a
healthcheck and Kibana waits for it, so the stack is usable once up -d returns.
Check it is alive:
curl -s http://localhost:9200/_cluster/health
{"cluster_name":"docker-cluster","status":"green","timed_out":false,"number_of_nodes":1,"number_of_data_nodes":1,...}
There is no native (non-container) install path for Elasticsearch in this script — it
needs a JVM and a vm.max_map_count of at least 262144 on the host, which is more
system-level setup than the script does for any other tool. Use the compose path above.
Configuration and credentials
| Service | URL | Credentials |
|---|---|---|
| Elasticsearch | http://localhost:9200 | none |
| Kibana | http://localhost:5601 | none |
The compose file sets xpack.security.enabled=false, so there are no credentials to
manage and the tutorial's Vector sink needs no auth block.
Security disabled means anyone who can reach port 9200 can read and delete every index,
and Records travel in cleartext. This is a demo setting. For anything else, re-enable
xpack.security, and give the passthrough sink an auth block (or an API key) — see the
commented example at the bottom of dc_demos/config/elasticsearch_sink.toml.
Two other settings are demo-shaped and worth changing before this stack is anything but local:
discovery.type=single-node— one node, so no replicas are ever allocated. Indices reportyellow, notgreen, because their replica shard has nowhere to go; that is expected here and not a symptom.ES_JAVA_OPTS=-Xms512m -Xmx512m— a small fixed heap so this fits next to a simulator on a laptop. Elasticsearch's own sizing guidance applies for a real deployment.
Kibana is only there to look at the data. On a constrained machine, comment its service
out — the tutorial's verification step queries the _search API with curl and needs
only Elasticsearch.
Grafana
Description
Grafana is a multi-platform open source analytics and interactive visualization web application. It provides charts, graphs, and alerts for the web when connected to supported data sources.
Start in a container
Execute:
./tools/infrastructure/scripts/install_infrastructure.bash \
--tool=grafana \
--install-type=docker
Start natively
./tools/infrastructure/scripts/install_infrastructure.bash \
--tool=grafana \
--install-type=native
What comes up with it
Datasource and dashboards are provisioned from
tools/infrastructure/docker/config/grafana/ — no manual import. The PostgreSQL datasource
(uid dc_postgres) points at the PostgreSQL container, and four
dashboards ship: Home, Robot, KPI (availability and uptime, backed by the
KPI views), and Fast DDS statistics.
Credentials
| User | Password | Port |
|---|---|---|
| admin | admin | 3000 |
How to use
Open http://localhost:3000 and log in; the provisioned dashboards are under Dashboards:
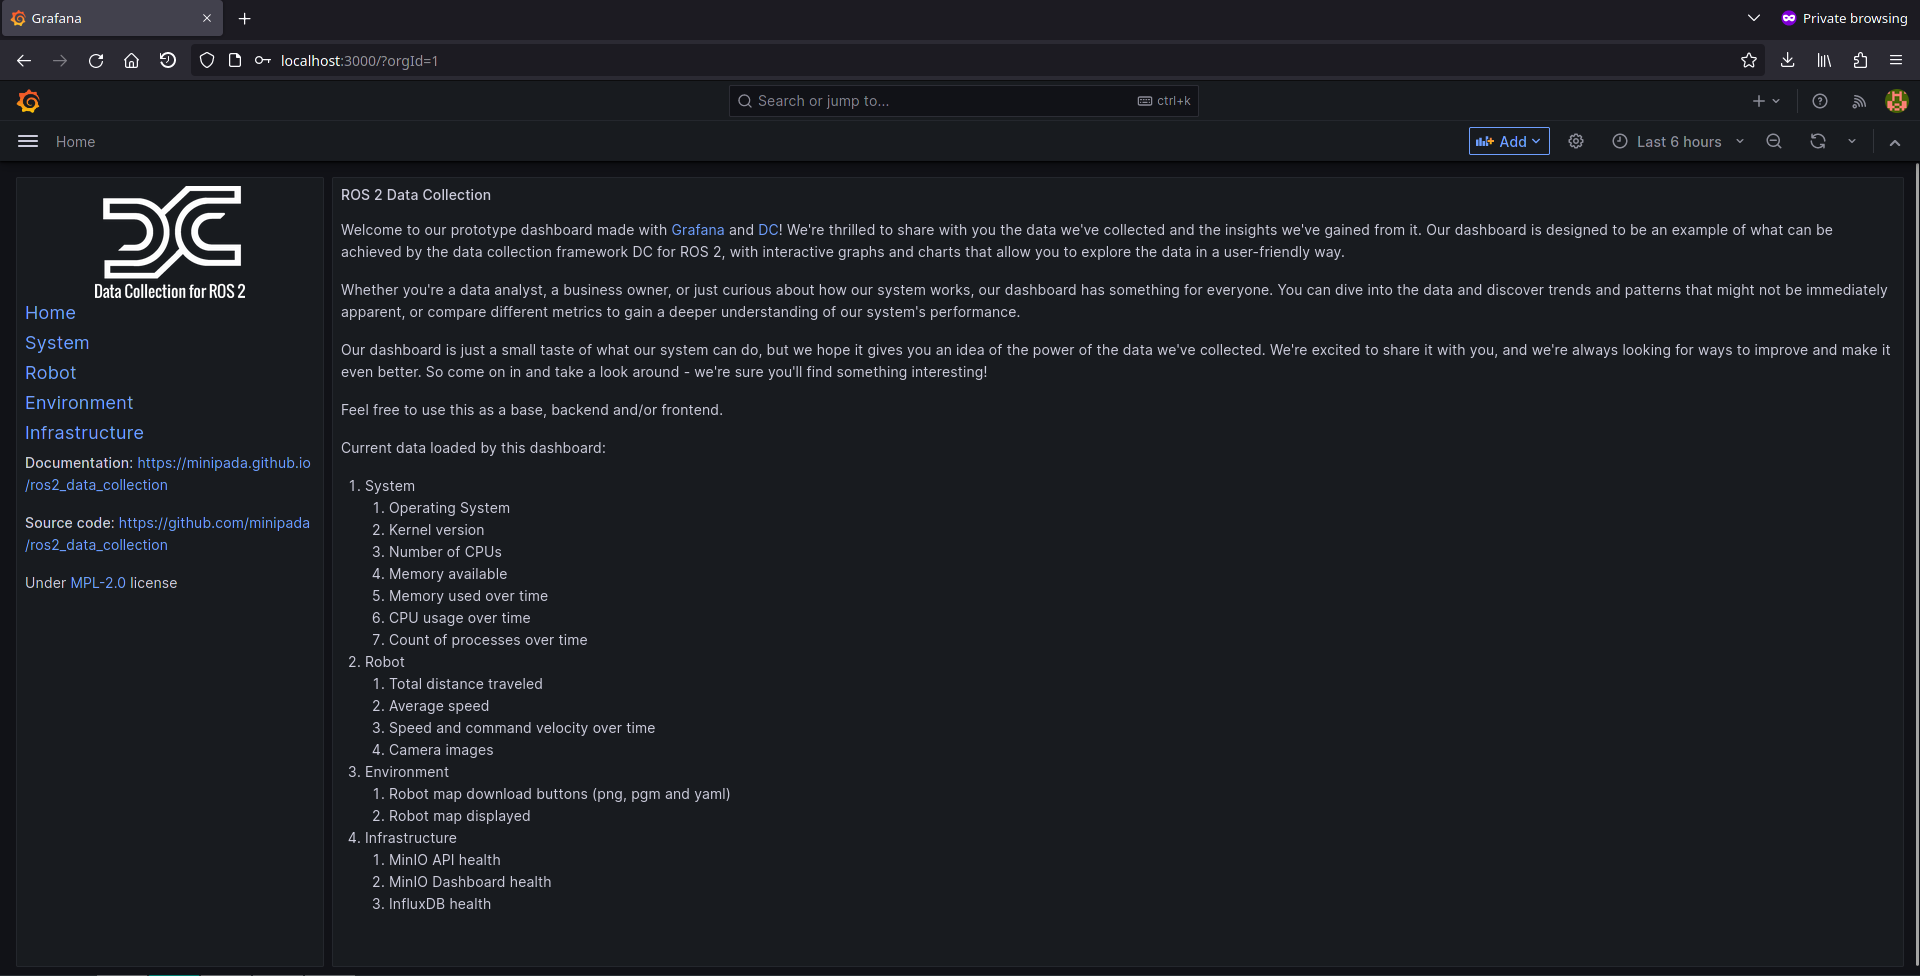
InfluxDB
Description
InfluxDB is a time-series database purpose-built for
metrics and events. DC has no blessed influxdb Destination — Vector's influxdb_logs
sink is reached through the passthrough Destination,
the same mechanism the InfluxDB demo uses.
Start in a container
Execute:
./tools/infrastructure/scripts/install_infrastructure.bash \
--tool=influxdb \
--install-type=docker
Start natively
./tools/infrastructure/scripts/install_infrastructure.bash \
--tool=influxdb \
--install-type=native
Credentials
| User | Password | Database | Port |
|---|---|---|---|
| admin | admin | dc | 8086 |
Ip cameras
To start the ip camera example, to save video feeds from rtsp cameras, you can optionally create a virtual video feed if you don't have an ip camera, for testing purpose:
Start RTSP Server
A rtsp server. I use mediamtx available here. Download from the release page and start it:
./mediamtx
If the port is already used, download the configuration and edit the hlsAddress parameter. You would then need to start it this way:
./mediamtx conf.yml
Create a virtual camera
This is optional, and only useful if you want to not use a camera
You will first need to install some packages:
sudo apt-get install v4l-utils v4l2loopback-dkms
And start a virtual camera device:
sudo modprobe v4l2loopback
Now check its path:
v4l2-ctl --list-devices
Dummy video device (0x0000) (platform:v4l2loopback-000):
/dev/video2
In my case, it is /dev/video2
To send your camera feed, run:
ffmpeg \
-f v4l2 \
-video_size 1920x1080 \
-i /dev/video2 \
-f rtsp \
-rtsp_transport tcp rtsp://127.0.0.1:8554/mystream
Send video stream
To send an image of a clock ticking, create a blank image and call it bg-white.png (with gimp for example) and run:
ffmpeg \
-re -loop 1 \
-i bg-white.png \
-vf drawtext="fontfile=monofonto.ttf: fontsize=96: box=1: boxcolor=black@0.75: boxborderw=5: fontcolor=white: x=(w-text_w)/2: y=((h-text_h)/2)+((h-text_h)/4): text='%{gmtime\:%H\\\\\:%M\\\\\:%S}'" \
-r 25 \
-vcodec libx264 \
-f rtsp -rtsp_transport tcp rtsp://127.0.0.1:8554/mystream
Now you can use the ip_camera plugin with the url from the command: rtsp://127.0.0.1:8554/mystream
RustFS
Requirements
- A container engine installed (Podman by default)
- Its compose plugin installed
Description
RustFS is an S3-compatible object storage server, written in Rust and licensed Apache 2.0. It is the s3 blessed Destination's recommended backing store — MinIO's community edition was archived upstream in 2026 and no longer receives maintenance, so DC 2.0's own examples and E2E harness (tools/e2e/) both target RustFS instead; existing MinIO or Ceph RGW deployments work identically since dc_bridge's s3 Destination just talks plain S3 API. See Destinations for the full Destination contract.
Start in a container
Execute:
./tools/infrastructure/scripts/install_infrastructure.bash \
--tool=rustfs \
--install-type=docker
This starts a single RustFS container plus a one-shot container that bootstraps the dc-files bucket the demo params files upload into (RustFS does not auto-create buckets on startup).
There is no native (non-container) install path for RustFS in this script yet — unlike MinIO, it has no apt/systemd packaging convention to mirror. Use the container path above.
How to use
RustFS listens on port 9000 and speaks the S3 API directly — point any S3-compatible client (mc, aws s3, or dc_bridge's own s3 Destination) at http://localhost:9000.
Credentials
| User | Password | Port |
|---|---|---|
| rustfsadmin | rustfsadmin | 9000 |
These are RustFS's built-in default credentials (no environment variables are set in docker-compose.rustfs.yaml) — set your own for anything beyond a local demo.
PostgreSQL
Description
PostgreSQL is a powerful, open source object-relational database system that uses and extends the SQL language combined with many features that safely store and scale the most complicated data workloads. The origins of PostgreSQL date back to 1986 as part of the POSTGRES project at the University of California at Berkeley and has more than 35 years of active development on the core platform.
Start in a container
Execute:
./tools/infrastructure/scripts/install_infrastructure.bash \
--tool=postgresql \
--install-type=docker
Start natively
Execute:
./tools/infrastructure/scripts/install_infrastructure.bash \
--tool=postgresql \
--install-type=native
Credentials
| User | Password | Database | Port |
|---|---|---|---|
| dc | password | dc | 5432 |
What comes up with it
The compose file applies two SQL files at first start:
tools/infrastructure/docker/config/postgresql/init.sql creates the dc and dc_files
tables the postgres Destination writes into, and tools/infrastructure/sql/kpi_views.sql
adds the KPI views the Grafana dashboards read.
Migration
This page tracks in-progress moves between configuration shapes DC itself is making — distinct from Configuration examples, which teaches the current shape from scratch.
Blessed postgres/s3/console → passthrough (completed)
ADR-0003 originally blessed
postgres, s3, file, console and vector with a ROS-param form rendered into
Vector config by dc_bridge. An audit of that blessed set found postgres, s3 (for
receives: records) and console carried no DC-specific logic — they were pure
Vector-sink wrappers, and Vector's own vector validate already gives clear,
field-level errors for them. Every in-repo demo, deploy param file and doc using them
was moved to passthrough first
(#471), then
dc_bridge's blessed code path for these three types was removed
(#472) — as of that
change, postgres, s3 (for receives: records) and console are only
configurable via passthrough; the blessed ROS-param form for them no longer exists.
file and vector are unaffected and remain blessed — file is a plain local-disk
Vector sink with no DC-specific logic either, but is kept as the cheap "anchor"
Destination every passthrough setup needs (dc_bridge derives its ROS subscriptions and
dc.<tag> routes from destinations alone, never from a passthrough snippet's
inputs); vector is reserved for the split-deployment/fleet work in
#440. s3 also stays
blessed for receives: files (File uploads,
ADR-0005) — that path is served
entirely by the Uploader's own S3 client, never by a Vector sink, so there is no
passthrough equivalent for it to migrate to.
Working passthrough recipes for postgres, s3 (records) and console — reproducing
exactly what dc_bridge used to render for the blessed form — are in
Destinations: Recipes.
Point custom_config_files at one of them, alongside a file (or vector) anchor
Destination; nothing else about your Measurements or routing changes.
kind: NetworkPolicy validation
The reference fleet architecture
(epic #440) claims a robot
tier has no internet route, sites cannot reach each other, and connections only ever flow
outward (robot -> edge -> hub). Routing alone does not prove that — NetworkPolicy is a
Kubernetes object, and enforcing it requires a CNI that implements it. This page proves it
with a real kind cluster (kubeadm, the same tool production
clusters use) running Calico, a real
policy-enforcing CNI — unlike the k3d dev loop's
default Flannel, which silently accepts NetworkPolicy objects without enforcing them.
Every command below is exactly what CI's verify-kind-networkpolicy job
(.github/workflows/ci.yaml) runs, one step each — no wrapper script standing between
this page and CI to fall out of sync with either. Run them in order to reproduce
locally, or read on for what each does and why.
Prerequisites
- Podman (pulling or building
dc-ros, loading it into the cluster) - Docker (kind's node runtime — see Docker dependency below)
kind(v0.33.0) andkubectl(v1.31.4) onPATH— CI installs these viahelm/kind-action'sinstall_only: truemode; seetools/kind/README.mdfor why (kind create cluster --wait, which that action otherwise always runs, can't succeed before Calico is installed)
1. Get the dc-ros image
kubernetes/robot-a.yaml commits a real default: ghcr.io/minipada/ros2_data_collection/dc-ros:rolling
— the same floating ref build-dc-ros-image pushes on every merge to rolling, and the
same one deploy/robot/kubernetes/robot-pod.yaml runs. (Not :latest — this repo
doesn't push that tag; :rolling is the one a real deployment actually pins to.) The
simplest reproduction just pulls it:
podman pull ghcr.io/minipada/ros2_data_collection/dc-ros:rolling
export DC_ROS_IMAGE=ghcr.io/minipada/ros2_data_collection/dc-ros:rolling
CI instead pulls the PR's just-built :<sha> image (build-dc-ros-image's own output)
— testing what this run actually built, same as verify-robot-manifests/
verify-runtime-images. To reproduce that case locally instead — testing a change
before it's pushed — build it yourself and point DC_ROS_IMAGE at the local tag:
TARGET=runtime IMAGE_TAG=dc-runtime:local ./tools/e2e/scripts/build.sh
podman build -t dc-ros:local -f containers/dc-ros/Containerfile --build-arg BASE_IMAGE=dc-runtime:local containers/dc-ros
export DC_ROS_IMAGE=dc-ros:local
Either way, step 4 substitutes DC_ROS_IMAGE into the manifest's default only when it
differs from :rolling — one workflow, whichever image you're pointing at.
2. Bring up the cluster and its CNI
kind create cluster --name dc-kind --config tools/kind/kind-config.yaml
kubectl --context kind-dc-kind apply -f https://raw.githubusercontent.com/projectcalico/calico/v3.32.2/manifests/calico.yaml
kubectl --context kind-dc-kind -n kube-system rollout status daemonset/calico-node --timeout=180s
kubectl --context kind-dc-kind -n kube-system rollout status deployment/calico-kube-controllers --timeout=180s
kubectl --context kind-dc-kind wait --for=condition=Ready nodes --all --timeout=180s
tools/kind/kind-config.yaml sets disableDefaultCNI: true — kind's own default
(kindnet) doesn't enforce NetworkPolicy either, so a node reports NotReady until
Calico is applied.
3. Load dc-ros into the cluster — no registry
podman save -o /tmp/dc-ros.tar "$DC_ROS_IMAGE"
kind load image-archive /tmp/dc-ros.tar --name dc-kind
Not kind load docker-image: that reads from the Docker image store, which a
Podman-built image never populates (CLAUDE.md "Containers: Podman, not Docker"). The
tar round trip is also what keeps this registry-free — the robot Pod below needs no
ghcr.io pull secret.
4. Apply the topology
# robot-a.yaml commits ghcr.io/.../dc-ros:rolling as dc-ros's real default — patched in
# place only if step 1 pointed DC_ROS_IMAGE somewhere else, before the kustomize build
# below reads the file.
sed -i "s|ghcr.io/minipada/ros2_data_collection/dc-ros:rolling|$DC_ROS_IMAGE|" \
tools/kind/kubernetes/robot-a.yaml
# Namespaces, networkpolicies, the hub, edge and robot tiers, the probe Pods, and all
# three ConfigMaps (generated from tools/kind/params/* and tools/e2e/sql/init.sql) — in
# one apply. kustomize ships in kubectl; see tools/kustomization.yaml for what's
# deliberately left out (the outage-inducing NetworkPolicy variant) and why the file
# lives at the tools/ root rather than inside tools/kind/ itself.
kubectl --context kind-dc-kind apply -k tools/
kubectl --context kind-dc-kind rollout status -n dc-hub deployment/hub-postgres --timeout=180s
kubectl --context kind-dc-kind rollout status -n dc-edge-a deployment/edge-vector --timeout=180s
kubectl --context kind-dc-kind wait -n dc-robot-a --for=condition=Ready pod/robot-a-probe --timeout=60s
kubectl --context kind-dc-kind wait -n dc-edge-a --for=condition=Ready pod/edge-a-probe --timeout=60s
kubectl --context kind-dc-kind wait -n dc-edge-b --for=condition=Ready pod/edge-b-probe --timeout=60s
timeout 90 bash -c \
"until kubectl --context kind-dc-kind logs -n dc-robot-a dc-robot -c dc-ros 2>&1 | grep -q 'dc_bridge reports ready'; do sleep 2; done"
Four namespaces: dc-robot-a and dc-edge-a (site A, the real topology under test),
dc-edge-b (a stand-in second site — nothing runs there but a probe Pod, just enough to
have a second site to deny), and dc-hub. See tools/kind/README.md's topology diagram
and each manifest's own header for what runs where and why.
5. Prove the claims
tools/kind/scripts/verify_network_policy.sh
Six kubectl exec ... nc -z connection attempts from dedicated probe Pods (same
podSelector: {} policy every real workload in that namespace is bound by):
| Attempt | Expected |
|---|---|
| robot-a -> public internet | denied |
robot-a -> dc-edge-b | denied |
dc-edge-b -> robot-a's edge (dc-edge-a) | denied |
dc-edge-b -> hub | denied |
robot-a -> dc-edge-a | permitted |
dc-edge-a -> hub | permitted |
Then the real check: wait for dc-ros's own Records to reach the hub's
Postgres through the edge aggregator, and check the row count.
6. Induced outage: the backlog buffers through it
sleep 15 # steady state
COUNT_BEFORE="$(kubectl --context kind-dc-kind exec -n dc-hub deploy/hub-postgres -- psql -U dc -d dc -tAc 'SELECT count(*) FROM dc_records' | tr -d '[:space:]')"
WINDOW_START_TS="$(date +%s)"
kubectl --context kind-dc-kind apply -f tools/kind/kubernetes/networkpolicy-robot-outage.yaml # cuts robot -> edge
sleep 30 # outage
kubectl --context kind-dc-kind apply -k tools/ # restore: same command that brought the topology up
sleep 15 # drain
COUNT_AFTER="$(kubectl --context kind-dc-kind exec -n dc-hub deploy/hub-postgres -- psql -U dc -d dc -tAc 'SELECT count(*) FROM dc_records' | tr -d '[:space:]')"
WINDOW_ELAPSED=$(( $(date +%s) - WINDOW_START_TS ))
DELTA=$(( COUNT_AFTER - COUNT_BEFORE ))
echo "records: $COUNT_BEFORE before, $COUNT_AFTER after (+$DELTA over ${WINDOW_ELAPSED}s)"
networkpolicy-robot-outage.yaml replaces dc-robot-a's NetworkPolicy object (same
name, same namespace) with a version that drops the egress-to-edge rule and keeps only
DNS — a real policy-enforced site-link outage rather than a stopped container. dc-ros and its
local Vector Shipper keep running and buffering to disk the whole time
(ADR-0002); once
the policy is restored, the buffered backlog flushes and the hub's row count catches back
up. CI additionally checks DELTA against WINDOW_ELAPSED seconds at the uptime
Measurement's 1Hz rate (tools/kind/params/robot-a-params.yaml), with a 70% lower bound
— a real loss would show up there as a permanent shortfall rather than a brief dip.
7. Tear down
kind delete cluster --name dc-kind
Docker dependency
kind runs each cluster node as a Docker container, and Calico's kind guide — which this
harness follows — is documented and tested against Docker. Podman has experimental kind
support (KIND_EXPERIMENTAL_PROVIDER=podman), but this harness doesn't depend on it: it
is throwaway CI test infrastructure, not something DC ships, so it uses real Docker
rather than an experimental path nothing else in this repo relies on. Building and
shipping DC itself stays on Podman, unchanged (CLAUDE.md "Containers: Podman, not
Docker") — Podman is the only tool that ever touches a DC image here; Docker's only job
is running the kind nodes. GitHub-hosted ubuntu-latest runners ship Docker
preinstalled, so CI needs no extra setup step for it.
CLI tools
dc_cli/package.xml doesn't declare a dependency on typer (the CLI framework this
tool is built on) — a real python3-typer rosdep key exists and resolves to a real
Ubuntu apt package, but nothing in package.xml tells rosdep to install it. A plain
rosdep install + colcon build leaves ros2 run dc_cli list_plugins failing with
ModuleNotFoundError: No module named 'typer'. pip install --break-system-packages typer (or add it to a uv-managed virtualenv) is the workaround until the package
declares it — or sudo apt install python3-typer directly.
List plugins
You can list available plugins by running the CLI tool:
ros2 run dc_cli list_plugins --help
Usage: list_plugins [OPTIONS] COMMAND [ARGS]...
╭─ Options ─────────────────────────────────────────────────────────────────────────────────────────────────────────────────╮
│ --install-completion Install completion for the current shell. │
│ --show-completion Show completion for the current shell, to copy it or customize the installation. │
│ --help Show this message and exit. │
╰───────────────────────────────────────────────────────────────────────────────────────────────────────────────────────────╯
╭─ Commands ────────────────────────────────────────────────────────────────────────────────────────────────────────────────╮
│ by-package List plugins of a pluginlib file with their descriptions, by package name and filename. │
│ by-path List plugins of a pluginlib file with their descriptions, by their path. │
│ conditions List condition plugins with their descriptions. │
│ measurements List measurement plugins with their descriptions. │
╰───────────────────────────────────────────────────────────────────────────────────────────────────────────────────────────╯
There is no destinations command. Destinations are not pluginlib plugins in DC 2.0
(ADR-0003): the blessed types are
listed in Destinations, and
everything else is reached through the passthrough.
Architecture Decision Records
An ADR records a significant architecture decision, the reasoning behind it, and what it
rules out. The list below is generated from
docs/adr/ —
edit an ADR there, not here.
External shipper process replaces embedded Fluent Bit
The Humble-era design embedded a forked Fluent Bit 2.1.3 as an in-process library, which forced us to maintain fluent_bit_vendor (source build of a patched fork), a custom C input plugin (in_ros2), and cgo-built Go output plugins — the dominant cause of install pain. For the Jazzy rewrite, the shipper runs as an external process, fed by a thin Bridge over the shipper ingest protocol. Install becomes "drop one prebuilt binary"; the fork, the vendor package, and the Go toolchain are deleted.
Considered Options
- Keep embedding (rejected: the fork/build burden is inherent to embedding, not fixable)
- Native C++/Rust destination implementations with our own buffering (rejected: re-implements buffering/backpressure/retry that shippers already do well, and caps destination breadth)
Consequences
- One extra process at runtime alongside the Bridge; negligible hop for JSON-sized Records.
- The Forward-protocol boundary makes the shipper swappable (Vector and Fluent Bit both consume it).
Amendment (#440/#444): supervision is no longer always "localhost, by DC's bringup"
This ADR originally read "the shipper runs as an external process on localhost, supervised by DC's bringup" without qualification. That is still the default (managed mode), but it is no longer the only supported shape: in unmanaged mode (#444) the Bridge renders the Shipper's config and connects over the shipper ingest protocol exactly as before, but does not locate a binary, spawn it, or supervise it — an orchestrator does, and the Shipper may run in its own container, possibly on a different host from the Bridge. See ADR-0015 for why the decomposition stops at the Shipper (and the Uploader) rather than extending further, and ADR-0014 for the Uploader's own extraction out of the Bridge process. Nothing about the shipper ingest protocol itself changes between the two modes; only who starts and watches the Shipper does.
Vector is the blessed default shipper
Both upstream Fluent Bit and Vector can sit behind the Bridge's Forward-protocol boundary. We bless Vector: its postgres and aws_s3 (MinIO-compatible) sinks are native and maintained where Fluent Bit's pgsql output stayed experimental and MinIO required our own Go plugin; VRL replaces our four chained Lua/rewrite-tag filter hacks with one typed transform; it adds end-to-end acknowledgements on top of disk buffering; and it ships as a single static binary (x86_64/arm64). Docs, demos, and generated config target Vector only — Fluent Bit remains a drop-in option for memory-starved targets (~5MB vs ~100MB RSS) but is not documented as a first-class path.
Consequences
- A
vector_vendorament package vendors the official static binary, pinned to an exact version by checksum (arch-detected); avector_pathparameter allows using a system-installed Vector instead. Apt-repo install and Docker remain documented alternatives.
Amendment: checked-in binary instead of a build-time download (#424)
vector_vendor originally fetched its pinned binary over the network at build time via
file(DOWNLOAD ...), which violates the ROS buildfarm's no-network-access policy for
binarydeb jobs and defeats #423's network-isolated build check. The "vector-slim"
feature-flagged build this ADR originally proposed CI would publish was never actually
built — no such CI job exists in this repo — so it is not available to vendor either.
Fixed by checking the official vectordotdev/vector release tarballs (x86_64 and
aarch64, same bytes file(DOWNLOAD ...) used to fetch, same pinned SHA256 checksums)
directly into vector_vendor/prebuilt/; CMakeLists.txt now extracts and installs from
the local file, performing no network I/O. The tarball, not the extracted binary, is
what's committed: the extracted vector binary is 120–142MB (stripped/unstripped)
depending on target, over GitHub's 100MB hard per-file limit, while the release
tarball's upstream gzip compression brings each architecture's file to ~50-54MB — under
the limit.
Not tracked via Git LFS, per #421's original implementation decision ("no
release-time injection step, no git-lfs: committed like any other tracked file").
LFS was evaluated and briefly adopted mid-review: the specific concern that motivated
#421's original call — that LFS content wouldn't survive bloom's release-tarball
export step — turned out to be unfounded. bloom's export_upstream delegates to
vcstools.GitClient.checkout() (a plain git clone + git checkout <tag>, which does
run LFS's smudge filter), and the export machinery itself
(vcstools.git_archive_all.GitArchiver) reads files off the working-tree filesystem
rather than through git archive's blob-store plumbing (the actual, narrower reason
plain git archive breaks LFS) — confirmed empirically against a throwaway LFS repo and
the real vcstools/bloom code, not just read.
LFS was reverted anyway for a more basic reason: GitHub's free LFS tier is 1GB storage and 1GB bandwidth per month, and every future Vector version bump adds both tarballs (~106MB) as new, non-deduplicated LFS objects — roughly 9 version bumps before storage alone exhausts the free tier, independent of and sooner than the plain-blob approach's own cost (git history growing by the same ~106MB per bump, but against no comparable quota). A plain committed blob has no such ceiling; the tradeoff is that every future Vector bump grows this repo's ordinary git history by ~106MB, permanently, since git does not deduplicate binary blobs across versions. Revisit if/when that accumulation becomes the more pressing cost — the LFS path is proven to work, should it be needed.
Amendment: split into its own repo, pulled in via .repos
The ~106MB-per-bump cost the previous amendment accepted as vector_vendor's tradeoff
doesn't have to be ros2_data_collection's cost to carry — nothing about the rest of
this repo's history needs to grow every time Vector ships a release. vector_vendor
now lives at github.com/Minipada/vector_vendor
(default branch jazzy, matching this repo's own active line), containing exactly what
used to sit at ros2_data_collection/vector_vendor/: the same CMakeLists.txt
(checked-in tarball, checksum-pinned, no network at build time — the previous
amendment's decision is unchanged, just relocated) and the same two prebuilt tarballs.
package.xml's <version> there tracks the vendored Vector version directly (0.57.0
at the time of the split), not an independent counter.
Pulled into this workspace via ros2_data_collection.repos (vcstool) rather than a
COPY/git submodule: vcs import pins to a tag (v<VECTOR_VERSION>), not a
branch, so a given ros2_data_collection commit always resolves the same
vector_vendor content — a floating branch would make the build's vector_vendor
content silently drift out from under an unrelated ros2_data_collection change.
tools/e2e/Containerfile's toolchain-base stage runs the import (network required,
same as its rosdep install right below it); every downstream stage's actual colcon build builds against the already-fetched result, unaffected by where the source
physically came from. Bumping Vector now touches
two repos: land the new binaries + tag in vector_vendor, then bump the pinned
version: in ros2_data_collection.repos to match.
This is a development-workspace convenience only (vcs import/colcon build from
source); it does not by itself make vector_vendor installable via apt — that
requires its own independent bloom-release into rosdistro, not yet done, at which
point ros2_data_collection packages that need it would instead declare a normal
<depend>vector_vendor</depend> and let rosdep resolve the released .deb, same as any
other ROS package dependency. Until then, .repos is how CI and local dev get a
buildable workspace.
Amendment: back to a live, checksum-pinned download (#435)
The no-network-access assumption the first amendment (#424) rested on — that ROS
buildfarm binarydeb jobs can't reach the network — is false. ros_buildfarm's own
job-generation source (ros_buildfarm/templates/release/deb/binarypkg_job.xml.em, the
"Run Dockerfile - build binarydeb" section) invokes docker run --net=host for the
container that runs the actual build step, and this isn't theoretical: zmqpp_vendor —
which fetches its own dependency live at colcon build time via
ament_cmake_vendor_package's ament_vendor() — has a real, currently succeeding
Jenkins job on build.ros2.org (Jbin_uN64__zmqpp_vendor__ubuntu_noble_amd64__binary,
build #12, SUCCESS). aws_sdk_vendor reached the identical conclusion independently
for its own build (docs/adr/0012) after resting on the same false premise.
With real network available at build time, the live-download design this repo used
before #424 is simply simpler than the checked-in-tarball design that replaced it, and
it sidesteps the checked-in design's actual cost entirely: nothing binary is committed
anywhere, so there is nothing for git to fail to deduplicate as Vector ships new
versions. vector_vendor/CMakeLists.txt reverts to file(DOWNLOAD ...), fetching the
official per-architecture release tarball at build time and verifying it against the
same pinned SHA256 checksums the checked-in design used — the vector_path override for
air-gapped/distro-packaged builds is unchanged. The checked-in prebuilt/*.tar.gz
tarballs are removed from Minipada/vector_vendor.
This does not reopen the "own repo" amendment above: vector_vendor stays split out,
independent of whether its own content is large enough to justify the split on git-bloat
grounds by itself — see docs/adr/0012's identical reasoning for aws_sdk_vendor, a
thin recipe with no bloat of its own that stays split anyway so every vendor package
this workspace pulls in via .repos follows the same layout and bump/release workflow.
Vector's vendored version is unchanged by this amendment (still 0.57.0), so
Minipada/vector_vendor's existing v0.57.0 tag was moved onto the new commit rather
than minted fresh — package.xml's <version> continues to track VECTOR_VERSION
exactly, and there is no independent counter to bump for a fetch-mechanism-only change.
tools/e2e/Containerfile's vendor-network-check stage (#423) already built
vector_vendor alongside aws_sdk_vendor under --network=none before this amendment
— it was a no-op inclusion back then, since the checked-in binary's colcon build
needed no network and so never failed. It stopped being a no-op here: vector_vendor's
build started failing under --network=none for the same reason aws_sdk_vendor's
always has, which is the change this amendment's own end-to-end verification confirmed.
The stage itself (and the CI job wired to it) was later deleted — see docs/adr/0013 —
once a permanently-failing check on both packages stopped being distinguishable from no
check at all.
If a future ROS buildfarm policy change does restrict binarydeb network access (the
false premise here becoming true later), this decision reverses again to the
checked-in-tarball design; nothing about that design is lost — it is documented in the
amendment above and in Minipada/vector_vendor's own git history, not deleted.
Why the forward protocol is the Bridge→Shipper wire format
The Bridge must hand Records to the Shipper across a process boundary such that the sender knows what arrived — durable ingest is impossible without receipt acknowledgement. Requirements: a listener the Shipper already ships, sender-visible acks, and a minimal Rust client. Vector's source menu, filtered:
socket,stdin— one-way byte streams; no response direction exists, so the Shipper cannot confirm receipt. A Shipper restart silently loses in-flight Records.file— durable, but Vector neither deletes consumed files nor exposes its checkpoint, so the Bridge would rotate blind (delete too early = loss, too late = unbounded disk); fixing that means building an acknowledged queue anyway.- websocket — Vector has a websocket sink, not a source.
http— ack-capable (response deferred until the event is buffered) but costs an HTTP client plus batching logic; equal capability at a higher price.vector(native gRPC) — ack-capable; drags tonic/prost/protobuf codegen into the Bridge for no functional gain.fluent(Fluentd's open "Forward" spec) — ack-capable (chunk/ackoptions are in the spec), and the client side is ~170 lines of msgpack over TCP. Chosen: the cheapest ack-capable listener.
The forward format is not Fluent Bit. It is an open wire specification from the
CNCF Fluentd project; no Fluentd/Fluent Bit software runs, links, or vendors into
DC 2.0 (the embedded Fluent Bit is demolished separately, ADR-0001). DC docs call
this boundary the shipper ingest protocol; the name "fluent" appears only in the
generated Vector config (type = "fluent") and interop documentation. A side effect,
not a goal: any forward-speaking receiver (including stock upstream Fluent Bit, ~5MB
RSS vs Vector's ~100MB) can be swapped in behind the boundary without Bridge changes.
Amendment: confirmed delivery closes the acks half of the promise (#266)
The "sender-visible acks" requirement above was satisfied by choosing an ack-capable
protocol, but until #266 the Bridge's Forwarder never actually used the chunk/ack option
— every frame was sent bare. Spiked directly against the pinned Vector 0.57.0 binary
before writing any C++: a hand-rolled msgpack client sending [tag, entries, {"chunk": id}] got back {"ack": id} even with the sink completely unreachable (connection
refused) and only a disk buffer engaged — confirming acks fire on durable-buffer-write,
not on final delivery to the Destination, which is the guarantee actually wanted here.
Also found: Vector 0.57 deprecates enabling acknowledgements on the source itself
in favor of the global [acknowledgements] enabled = true form (identical ack
behavior, no deprecation warning) — the renderer uses the global form.
A second on-disk queue for this window (mirroring the Uploader's intent queue, #265)
was considered and rejected in review: Vector's own disk buffer
(shipper.buffer_max_bytes) already covers sink/Destination outages, and the
bridge_ready_gate (ADR-0006) already covers "Vector isn't listening yet" at startup.
What was missing was purely the in-flight window — a Record already handed to a
send() call whose ack never arrives (Vector respawning, a TCP hiccup) — which an
in-memory (not disk-backed) bounded window closes cheaply. The double failure of "Bridge
crashes while this in-memory window is non-empty" is accepted as out of scope, same as
this ADR's original ready-gate/disk-buffer split assumed no double failures either.
Destination config: blessed set via ROS params, everything else via passthrough
The pluginlib destination-plugin layer is retired. DC generates shipper sink config from plain ROS parameters for a blessed set only — PostgreSQL, S3-compatible object storage, file, console — via templating in the Bridge. Every other destination (Kinesis, InfluxDB, Slack, Kafka, …) is configured by passing raw Vector sink config through a custom_sinks parameter, which exposes the shipper's entire catalog at zero DC code and keeps the "one tool handles all destinations" promise.
Consequences
- Every Destination — whether it receives Records or Files — is declared in the single
destinationslist, distinguished by areceives: records|filesproperty; only File policy (delete-after-verified-upload, metadata destination) lives in a separate block. This keeps the config aligned with the glossary: a Destination is a Destination. - The passthrough routing contract is public API: the Bridge exposes one Shipper route per Tag under the stable name
dc.<tag>, and custom sink snippets consume those names. This name is chosen deliberately here so implementation doesn't improvise it.
Considered Options
- Keep per-destination pluginlib plugins (rejected: permanent per-sink maintenance; the layer was only ever plumbing around Fluent Bit's C API)
- Raw Vector config only (rejected: loses ROS-native UX for the 90% path)
The Bridge is written in Rust (rclrs) as a contained pilot; the rest stays C++
We want first-party Rust in the project, but a full core rewrite was rejected: DC's value is its dynamically-loaded plugin ecosystem, and Rust has no stable ABI for dynamic plugins, while rclrs still lacks lifecycle nodes, message_filters, and pluginlib equivalents — a rewrite would be a 6–12 month redesign that discards 30+ tested C++ plugins. Instead, the new Bridge node is Rust: new code, no pluginlib dependency, minimal ROS surface (subscribe, socket forward, config render, child-process supervision), squarely within rclrs's capability. Measurements, conditions, groups, and lifecycle management remain C++.
Consequences
cargo/rustup joins the source-build toolchain (while Go and the C fork leave — net fewer toolchains than Humble).- If the pilot proves out and rclrs matures, Rust can expand component-by-component from a working system; if not, the loss is one small package.
File uploads live in the Bridge, not the shipper
Log shippers move event streams, not arbitrary local files as named objects — which is why the Humble design needed custom Go plugins (out_minio, out_files_metrics). In the Jazzy design the Bridge hosts an uploader module (Rust, object_store crate: S3/MinIO/GCS/Azure) that uploads Files, verifies they landed, extracts metadata (content-type, size, video duration), and emits the resulting metadata Record through Vector to PostgreSQL like any other Record. Delete-after-confirmed-upload and the upload-status table are preserved as features; local deletion stays robot-side.
Consequences
- PostgreSQL writes happen only via Vector's parameterized sink — this retires the string-formatted SQL in the Go plugin and gives file metadata the same buffering/retry guarantees as all Records.
- Consumers never guess completeness: multi-File groups (map = pgm+yaml, camera batches) get an explicit group completion marker written by the uploader only after every File in the group is verified — the "manifest as completion checkpoint" pattern, borrowed from dataset-platform upload design.
- Large Files upload multipart and resume after interruption rather than restarting, since robot networks are flaky and videos/maps are large;
object_storeprovides this natively.
The Bridge is a plain node, outside the lifecycle manager
Every other DC node is a nav2-style lifecycle node orchestrated by dc_lifecycle_manager (bond heartbeats, autostart). The Bridge deliberately is not: rclrs has no lifecycle-node or bond support, and the Bridge has no meaningful deactivated state — it is infrastructure, like the shipper itself. Startup determinism comes from launch ordering instead: Vector → Bridge → readiness gate → lifecycle manager activates collection nodes. Supervision is launch respawn (Bridge) and the Bridge supervising the Vector child process.
Consequences
- Lifecycle introspection does not cover the Bridge; monitoring it means "process up + ready service answers".
- If rclrs gains lifecycle support, the Bridge can adopt it without changing this boundary.
The Bridge returns to C++; the Rust pilot (ADR-0004) is reverted
Supersedes: ADR-0004 (Rust Bridge pilot).
ADR-0004 made the new dc_bridge node Rust (rclrs) as a deliberately contained pilot
— its own words: "We want first-party Rust in the project." The bet was explicitly
reversible: "if not, the loss is one small package." We are exercising that exit
clause. The Bridge is now plain C++ (ament_cmake, rclcpp); everything else about the
DC 2.0 architecture (external Vector shipper, shipper ingest protocol boundary, blessed
Destinations + passthrough, the Uploader's verify-then-delete semantics) is unchanged.
Why
The pilot's stated goal was to prove that first-party Rust could live in DC at low risk. On ROS 2 Jazzy, today, it does not clear that bar — the cost is in the toolchain, not the Bridge's own logic:
ros2_rusthas no stable Jazzy release. Buildingdc_bridgerequiredvcs-importing the ROS message repos and therosidl_rustcode generator pinned to a specific git commit (Jazzy ships norosidl_generator_rs, and pre-built apt message packages carry no Rust bindings). The generator androsidl_runtime_rsare developed in lockstep and had already drifted out of sync once, forcing a[patch.crates-io].colcon-ros-cargolink-flag generation is incomplete. A full-workspace build (as opposed to the narrower--packages-up-to dc_bridgeevery pilot PR verified with) made sibling interface packages "discoverable" via the ament index, at which pointrclrs's build script emitted-l<pkg>__rosidl_typesupport_cflags for packages nothing supplied a matching-Lfor — surfacing as opaque "unable to find library" link failures that took real debugging to root-cause and only "fixed" byCOLCON_IGNORE-ing packages back out of the index.- Every CI/dev environment paid for it. The image needed rustup,
colcon-cargo/colcon-ros-cargo,libclang, the source-built message repos, and a stack ofCOLCON_IGNORE/--skip-keysworkarounds — none of which are about what the Bridge does.
Against that, none of the Bridge's actual responsibilities need Rust. Talking to Vector
is the shipper ingest protocol (msgpack over a TCP socket); process supervision is
fork/exec/waitpid + PR_SET_PDEATHSIG; config rendering is string/TOML
generation; the File uploads (ADR-0005) are S3 multipart, which the AWS SDK for C++
provides directly. The Humble line did S3 uploads with a single minio-go call and no
resumability at all, so nothing here is beyond C++.
The decisive factor is developer experience, of which the CI simplification is only
the visible symptom: as C++, dc_bridge is an ordinary ament_cmake package. A
contributor clones the repo and runs rosdep install && colcon build — the same as
every other dc_* package. That plug-and-play property is exactly what the pilot was
meant to test for Rust and, on Jazzy today, could not deliver.
Decision
dc_bridgeisament_cmakeC++ (rclcpp). The ROS-independent core (Forwarder, Supervisor, Readiness, TopicConfig, ConfigRenderer) is a plain library, unit-tested withgtestand buildable/testable without a ROS install — preserving thedc_bridge_core"pure logic, no ROS needed to test it" property the Rust design had.- Dependencies are all rosdep-resolvable:
rclcpp,dc_interfaces,std_msgs,std_srvs,nlohmann-json-dev, plustomlplusplus/msgpack-cxx(header-only C++ libraries) via a small repo-local rosdep source (rosdep/dc.yaml) since upstream rosdistro has no key for them. - The File Uploader (ADR-0005) uses the AWS SDK for C++ against S3-compatible object storage, verified working against RustFS (PutObject + multipart) before adoption.
Consequences
- Rust, rustup,
colcon-cargo/colcon-ros-cargo,libclang, the source-built message repos (ros2_data_collection_jazzy.repos), and everyCOLCON_IGNORE/--skip-keysRust workaround leave the tree. The toolchain is smaller than the Rust pilot's and than Humble's (Go and the Fluent Bit C fork were already gone per ADR-0001). - Signal handling is simpler:
rclcpphandles SIGINT/SIGTERM and returns fromspin(), andon_shutdownstops the supervised Vector — the Rust node needed an explicitctrlchandler to avoid orphaning Vector becauserclrs::Context::ok()never returned false. - First-party Rust in DC is deferred, not foreclosed. If
ros2_rustmatures to a stable distro release with reliablecolconintegration, the experiment can be revisited from a working C++ baseline — the same component-by-component path ADR-0004 imagined, just in the other direction for now.
dc_util owns parameter declaration; nav2_util stays a dependency
Before this decision, parameter declaration in dc_measurements/dc_group was three
patterns at once: most Measurement/Condition plugins called
nav2_util::declare_parameter_if_not_declared directly, duplicating the same
declare-then-get_parameter-then-fatal-on-failure boilerplate in each onConfigure();
measurement_server.cpp mixed that with a handful of raw declare_parameter calls for
its own node-level parameters (which throw on redeclaration instead of being idempotent);
and a dc_util::get_*_type_param() helper family existed but was only used in ~20 of the
roughly 90 plugin-parameter call sites, wrapping nav2_util::declare_parameter_if_not_declared
for the rest without most callers going through it.
Decision
nav2_utilstays a dependency.MeasurementServeralready inheritsnav2_util::LifecycleNodefor the bond/lifecycle machinerydc_lifecycle_managerorchestrates — droppingnav2_utilisn't on the table regardless of how parameter declaration is handled, so re-implementingdeclare_parameter_if_not_declared's idempotent-declare logic insidedc_utilwould only add a second implementation of the same thing for no dependency-removal benefit.dc_util::get_*_type_param()/get_*_param()become the single sanctioned way to declare a parameter indc_measurements/dc_groupC++ code. Plugin authors call these, neverdeclare_parameterornav2_util::declare_parameter_if_not_declareddirectly (documented indoc/src/dc/contributing.md). Internally these helpers still callnav2_util::declare_parameter_if_not_declared—dc_util/include/dc_util/node_utils.hppis now the only file indc_measurements/dc_groupallowed to referencenav2_utilfor parameter declaration — so the dependency is kept, but callers no longer see it or hand-roll its error handling.- The helper family was extended to cover every parameter type actually declared across
the plugins (
double, and mandatoryvector<bool>/vector<int64_t>/vector<double>were missing) plus a node-level (unprefixed) variant forMeasurementServer's own parameters, so the rawdeclare_parametercalls in its constructor could move to the same idempotent pattern as everything else. dc_group(Python/rclpy) keeps its existing plainself.declare_parameter(...)calls. There is no Python equivalent ofnav2_util::declare_parameter_if_not_declaredin this codebase, and none is needed: everyGroupServerparameter is declared exactly once, ininit_parameters(), never re-entered — the idempotent-declare problem the C++ helpers solve (multiple plugins/onConfigure() calls potentially racing to declare a shared namespace) doesn't exist on the group-server side. Introducing a declare-if-not-declared wrapper there would be solving a problem this file doesn't have.
Consequences
- A new plugin parameter is one
dc_util::get_*_type_param()call, not a declare-if-not-declared pair plus a manual fatal-on-missing check. - Two pre-existing bugs surfaced while converting call sites —
bool_equal.cpp'svalue_field isdoubledespite the parameter being declaredPARAMETER_BOOL, anddistance_traveled.cppdeclarestransform_tolerancebut reads back the different, undeclared nametransform_timeout— were deliberately left as directnav2_util::declare_parameter_if_not_declared/get_parametercalls rather than folded into the new helpers, so as not to silently change behavior while unifying the declaration pattern. Both are noted inline and are follow-up work, not part of this change.
MCAP recording is a passthrough consumer, not a blessed Destination
Issue #210 asks for Records to be recordable as .mcap files so they can be replayed
with ROS 2 bag tooling (ros2 bag info, Foxglove). Vector — the DC 2.0 Shipper (ADR-0002)
— has no MCAP sink, so this cannot be a config-only addition the way postgres/s3/
file/console were; ADR-0003 gives two shapes and asks that the choice be recorded
before implementing.
Decision: passthrough (dc_mcap_writer), not a Bridge-side blessed Destination.
dc_mcap_writer is a small standalone process (ament_python package, no ROS
dependencies of its own) that consumes Records the same way every other non-blessed
sink does — over the public dc.<tag> routes (ADR-0003), via a custom_config_files
passthrough snippet using Vector's socket sink (TCP, newline-delimited JSON) pointed
at it. It registers one JSON-schema Channel per Tag (the pattern in the linked
foxglove/mcap jsonschema/writer.cpp example) and rotates to a new .mcap file by
size or elapsed time, whichever comes first.
Why not the Bridge-side option
Local-first recording that survives a Shipper outage — the one stated justification in #210 for putting MCAP writing inside the Bridge — is not a requirement here: DC's Shipper is already at-least-once and disk-buffered per blessed sink (ADR-0002), so a robot losing connectivity does not lose Records either way, it just delays them. Adding MCAP writing to the Bridge would put a second delivery path (own file handles, own rotation policy, own failure modes) next to the Vector handoff, permanently, for a capability every other non-blessed destination gets by being outside the Bridge entirely (#246). That asymmetry is exactly what ADR-0003 exists to avoid.
Consequences
- No
dc_bridgecode changes:destinationsstill only names blessed sinks (console/file/… ) to route the topics MCAP recording needs onto theirdc.<tag>routes, same as the Elasticsearch and InfluxDB passthrough demos. dc_mcap_writergets Vector's default in-memory sink buffer, not the Bridge's disk buffer — consistent with every other passthrough sink (see the "Passthrough:custom_config_files" section ofdoc/src/dc/destinations.md), not a special case for MCAP.- Rotation and retention are
dc_mcap_writer's own concern, notdc_bridge's — there is no dependency on the Files retention policy (#267), which governs the Bridge's Uploader intent queue, an unrelated code path. - If local-first recording that survives a Shipper outage later becomes a real
requirement, that is grounds to revisit this decision, not to extend
dc_mcap_writerto fake it (e.g. its own persistent queue) — the honest answer at that point is a Bridge-side writer per the rejected option below.
Considered Options
- Bridge-side blessed Destination (
dc_bridgewrites MCAP itself, bypassing Vector) — rejected: no stated requirement for local-first durability past what the Shipper already gives every blessed sink, and it would duplicate a delivery path inside the Bridge indefinitely for one sink type.
The Mission Measurement's lifecycle contract: nav2 adapter scope and Record shape
ROS has no standard interface for mission or task lifecycle. Issue #305 asked two questions before any Mission Measurement could be written: how far a built-in nav2 adapter should go inferring "mission" from action goal status, and what an escape-hatch message for stacks with their own mission executive should look like. This ADR records that decision so #387 (the nav2 adapter) and later adapters (Open-RMF, a mission executive) can implement against it without re-litigating scope.
Decision: the nav2 adapter reports exactly one NavigateToPose goal's lifecycle, and
every adapter — nav2 or otherwise — emits the same StringStamped/JSON Record shape
used by every other Measurement, not a new typed dc_interfaces message.
Nav2 adapter scope
The nav2 adapter derives mission_start/mission_end purely from one NavigateToPose
goal: acceptance, terminal status, and result. It deliberately does not infer anything
above that:
- A "mission" that spans more than one nav2 goal (a multi-waypoint run coordinated by an external mission executive) is out of scope — nav2 has no concept of it, so DC will not guess at grouping goals into one mission.
- A mission sourced from a stack other than nav2 (Open-RMF, VDA5050, a custom mission
executive) is out of scope for this adapter.
mission_idandmission_typeexist on the Record specifically so a future adapter can supply its own values without a schema change or reopening this decision. NavigateThroughPosesandFollowWaypointsare separate nav2 action interfaces with their own goal/feedback/result shapes; they get their own adapters, not a generalized one, tracked as issues blocked by #387.
The escape-hatch: no new message, reuse the existing Record contract
Every Measurement in this codebase (battery, intervention, fault) publishes
dc_interfaces::msg::StringStamped carrying a JSON payload validated against a
dc_measurements JSON Schema — there is no precedent for a typed dc_interfaces
message per Measurement. The Mission Measurement does not introduce the first
exception: a stack with its own mission executive is a new Measurement plugin (or a
future generic "external mission" plugin) publishing the same Record shape below with
its own mission_id/mission_type, not a new dc_interfaces message type.
Record shape
event:"mission_start"or"mission_end", required — matchingbattery'scharge_session_start/_endconvention (a named episode kind), notintervention/fault's genericstart/end.mission_id: string, required on both events. The nav2 adapter synthesises it from the goal UUID (unique_identifier_msgs/UUID, stringified). Typed as a string, not an incrementing integer likebattery'ssession_id, so a future adapter can supply an externally issued id (a WMS order number, an Open-RMF booking id) without a type change.mission_type: optional string. The nav2 adapter sets it to the nav2 action name ("navigate_to_pose","navigate_through_poses","follow_waypoints"for sibling adapters). The schema accepts any string so a non-nav2 source can supply a richer value later without a schema change.sequence: integer, monotonic, incremented per emitted Record from one Measurement instance (not permission_id) — gap detection, mirroringfault's global counter.outcome: required onmission_endonly. Enum:succeeded,failed,cancelled,aborted. For the nav2 adapter:GoalStatus.ABORTED→aborted,GoalStatus.CANCELED→cancelled, andfailedis driven by a documented application-level condition (non-zeroNavigateToPose::Result.error_codeon an otherwise-succeeded goal status) rather than being collapsed intoaborted.reason: string, required onmission_endwhenoutcomeisfailedoraborted. Free text — for the nav2 adapter, verbatim fromNavigateToPose::Result.error_msg. No DC-invented coded/structured reason table.error_code: integer, required alongsidereason. For the nav2 adapter, verbatim fromNavigateToPose::Result.error_code.duration_sec: number, required onmission_endonly.recoveries: integer, optional onmission_end— for the nav2 adapter, fromNavigateToPose::Feedback.number_of_recoveriesat goal completion.- No
update_id/order-update field: a VDA5050-specific mid-mission-amendment concept with no evidence DC needs it; adding it later is a non-breaking schema change.
A mission still running at shutdown
There is no explicit "open" field on the Record. A mission still running when the
process stops simply never gets a mission_end Record — nothing downstream can average
an unclosed interval as zero-duration, because there is nothing to average. Deriving an
"open"/still-running signal at query time (the way dc_kpi_intervention_rate derives
open_interventions) is the concern of the mission-success-rate view deferred from
#363, not this Record schema.
Consequences
- #387 (the nav2
NavigateToPoseadapter) and its siblings forNavigateThroughPosesandFollowWaypointsimplement against this Record shape and scope boundary without needing further design discussion. - A future non-nav2 adapter (Open-RMF is the leading candidate; VDA5050 explicitly is
not, per #305) targets the same
mission_start/mission_endcontract, supplying its ownmission_id/mission_type, rather than requiring a new message type or a schema redesign. dc_measurements/plugins/measurements/json/mission_nav2.json(and any sibling adapter's schema) validates against this shape; downstream views (#363's deferred mission-success-rate panel) can rely onoutcomeandsequencehaving the same meaning across every adapter that targets this contract.
Considered Options
- A new typed
dc_interfacesmessage for mission lifecycle events — rejected: no existing Measurement publishes a typed message for structured data: introducing one here would be the first exception to a load-bearing convention, for no benefit over the JSON Record + schema every other Measurement already uses. - An adapter that groups nav2 goals into multi-goal missions itself (e.g. by proximity
in time) — rejected: nav2 has no concept of a multi-goal mission, so any grouping
heuristic DC invented would be a guess it could not honestly stand behind; the
mission_id/mission_typeescape hatch defers that grouping to a system that actually has the information.
aws_sdk_vendor fetches aws-sdk-cpp live from GitHub; the flattened-source design is rejected
aws_sdk_vendor builds aws-sdk-cpp (core + s3 only) by cloning
github.com/aws/aws-sdk-cpp.git directly at colcon build time, via
ament_cmake_vendor_package's ament_vendor() macro (VCS_TYPE git) — the same idiom
zmqpp_vendor/tinyxml_vendor/yaml_cpp_vendor already use successfully on the real
ROS buildfarm. No aws-sdk-cpp source is vendored anywhere: aws_sdk_vendor itself lives
in its own repo, github.com/Minipada/aws_sdk_vendor (mirroring vector_vendor's split,
ADR-0002's amendment), but that repo now holds only this package's CMakeLists.txt and
package.xml — a thin recipe, not a vendored source tree.
Why
An earlier design (#425, worked out in PR #433) kept aws_sdk_vendor in its own repo but
flattened aws-sdk-cpp's pinned source into it, plain-committed and pruned to exactly what
-DBUILD_ONLY=s3 compiles, so no network fetch happened at colcon build time at all.
That design rested on one assumption: that ROS buildfarm binarydeb jobs run with no
network access, the same constraint that motivated vector_vendor's checked-in-binary
amendment (see ADR-0002).
That assumption is false for the actual compilation step. ros_buildfarm's own
job-generation source
(ros_buildfarm/templates/release/deb/binarypkg_job.xml.em, the "Run Dockerfile - build
binarydeb" section) invokes docker run --net=host for the container that runs the
build. And this isn't theoretical: zmqpp_vendor — which does exactly this
live-git-clone-at-build-time pattern via ament_vendor() — has a real, currently
succeeding Jenkins job on build.ros2.org
(Jbin_uN64__zmqpp_vendor__ubuntu_noble_amd64__binary, build #12, SUCCESS).
vector_vendor's problem was never generic buildfarm network isolation; it was Vector
shipping as a large pinned binary rather than buildable source, which the buildfarm has
no story for regardless of network access, and which ament_vendor() doesn't help with
either.
Given real network access, a live fetch is simpler than a flattened source and needs no
vendored tree, no separate REUSE audit of ~2600 upstream files, and no manual re-pruning
on every AWS SDK version bump. crt/aws-crt-cpp's own submodule chain (13 submodules,
one of which — s2n's CBMC formal-verification model — is unrelated to
-DBUILD_ONLY=s3) can be let recurse in full via ament_vendor()'s vcs import --recursive: with real network available, the one extra unused clone is harmless, and
vcs import has no mechanism to exclude a single nested submodule anyway.
aws_sdk_vendor staying in its own repo, rather than moving back into
ros2_data_collection, is a separate call from the fetch-mechanism question above: this
package's own content (CMakeLists.txt + package.xml) is small either way, so unlike
vector_vendor's split — which exists specifically to keep ~106MB/bump of binary growth
out of ros2_data_collection's git history — there's no bloat this split avoids. It
stays split anyway so every vendor package this workspace pulls in via .repos follows
the same layout and the same bump/release workflow.
Decision
github.com/Minipada/aws_sdk_vendor'sCMakeLists.txtcallsament_vendor()withVCS_TYPE git,VCS_URL https://github.com/aws/aws-sdk-cpp.git, andVCS_VERSIONpinned to the same tag ADR-0007's Phase 2 verified against RustFS.GLOBAL_HOOKis required:dc_bridge(the real downstream consumer) only ever callsfind_package(AWSSDK), neverfind_package(aws_sdk_vendor)first, so the install prefix has to reachCMAKE_PREFIX_PATHvia an environment hook applied unconditionally, not a CMake config-extra a consumer would only pick up byfind_package()-ing this vendor package itself.- The flattened
vendor/aws-sdk-cpp/tree #425/PR #433 committed intogithub.com/Minipada/aws_sdk_vendoris removed from that repo; it now holds only the thinament_vendor()recipe.ros2_data_collection.reposgains anaws_sdk_vendorentry (pinned to a tag, alongsidevector_vendor's), the samevcs importpathvector_vendoralready uses. tools/e2e/Containerfile'svendor-network-checkstage kept proving the lack of network isolation is expected foraws_sdk_vendorfor a while after this decision — under--network=noneitscolcon buildwas supposed to fail, same as it always has, since nothing about this decision changes what the buildfarm actually does for this package. The stage (and the CI job wired to it) was later deleted, see docs/adr/0013: a check that fails by design, permanently, for both vendor packages it covers stopped being distinguishable from no check at all.
Consequences
- No aws-sdk-cpp source lives in
ros2_data_collection, inMinipada/aws_sdk_vendor, or anywhere else — one less REUSE audit surface, and no manual pruning step on every AWS SDK version bump (just moveAWS_SDK_VERSION). aws_sdk_vendor'scolcon buildstep needs network, same as it always has since ADR-0007;toolchain-base'svcs import(which fetches bothvector_vendorandaws_sdk_vendor) stays isolated fromtools/e2e/Containerfile's own build steps.- Bumping the AWS SDK version now touches two repos, same as bumping Vector already
does: land the new
AWS_SDK_VERSION/<version>/tag inMinipada/aws_sdk_vendor, then bump the pinnedversion:inros2_data_collection.repos. - If a future ROS buildfarm policy change does restrict binarydeb network access (the false premise here becoming true later), this decision reverses again; nothing about the flattened-source design explored in PR #433 is lost — it is documented there and in this ADR's history, not deleted.
Remove the network-isolation-check CI job and vendor-network-check stage
tools/e2e/Containerfile's vendor-network-check stage and CI's network-isolation-check
job (#423) are deleted, along with tools/e2e/scripts/verify_network_isolation.sh. The
check they implemented — "does aws_sdk_vendor's and vector_vendor's colcon build
succeed under --network=none" — no longer has anything to verify: both packages fetch
their dependency live over the network at colcon build time by design (docs/adr/0002's
reversal, #435; docs/adr/0012, #434), so the check now fails by construction, always, for
both packages it covers.
Why
The check was built (#423) on the assumption that ROS buildfarm binarydeb jobs run with no
network access. #434's research (ros_buildfarm's own docker run --net=host for the
binarydeb build step, zmqpp_vendor's real succeeding buildfarm job using an equivalent
live-fetch pattern) showed that assumption false. Once #434 and #435 reversed both vendor
packages back to live network fetches, the check stopped testing anything achievable: it
fails on every run, forever, for the same reason every time, and nothing about that reason
is a bug it could ever stop reproducing — it's the intended design those two ADRs record.
The job had already been reduced to if: false before this decision, because a disabled
job still reports a red ❌ check-run conclusion on every PR (independent of
continue-on-error, which only affects the workflow's aggregate conclusion), with
nothing actionable behind it. Keeping the job, the stage, and the script around in that
disabled state is dead weight: code that never runs, whose only content is restating a
decision already recorded in docs/adr/0002 and docs/adr/0012.
Two alternative rationales were considered for keeping some form of the check, both raised by #436 itself:
- Build-determinism/reproducibility safeguard. A check earning that rationale would
assert something about the build output's reproducibility — that the pinned checksum
(
vector_vendor) or pinned tag (aws_sdk_vendor) actually resolves to the same content run over run.--network=noneasserts nothing of the kind; it only asserts "no network reached this step," which is now always false by design. Repurposing the stage into a real reproducibility check would mean writing a materially different one, not weakening the existing one, and no evidence surfaced during #434/#435 that reproducibility of the pinned fetches is a risk this repo has actually hit. - Protection against transient upstream (GitHub/crates/apt mirror) unavailability
during a real release build. A genuine operational concern, but
--network=nonedoesn't model it — cutting network entirely is the opposite of a flaky network, not a simulation of one. A release build failing because GitHub is briefly unreachable is already visible, attributable, and retryable the same way any other CI network flake is, with no dedicated isolation check required. Retry-on-flake, if wanted later, is abloom-release/CI workflow concern (retries, backoff) — unrelated to build-time network isolation.
Neither rationale survives contact with what the existing check actually mechanically tests, so there is no "weakened" version of it worth keeping.
Decision
tools/e2e/Containerfile'svendor-network-checkstage is deleted..github/workflows/ci.yaml'snetwork-isolation-checkjob is deleted.tools/e2e/scripts/verify_network_isolation.shis deleted.toolchain-base— the stagevendor-network-checkused to branch from — is kept: it still earns its keep as the cache-layering split between the OS/apt-tools layer and the vendor-repovcs import, independent of the now-removed stage that used to branch from it too.- docs/adr/0002 and docs/adr/0012's own descriptions of the check as it existed at the time each ADR was written are left as historical record; each links here where it implied the check would keep running going forward.
Consequences
- No CI job or Containerfile stage references "network isolation" for these vendor packages any more — that they fetch live, by design, is fully covered by docs/adr/0002 and docs/adr/0012 alone.
- If a future ROS buildfarm policy change restricts binarydeb network access again (the
false premise both those ADRs found reversing back to true), reintroducing a real
network-isolated build check is straightforward:
RUN --network=nonearound acolcon build --packages-select aws_sdk_vendor vector_vendoris exactly what this ADR removes, and both ADRs it depends on document why it existed and how it worked. - #423 itself stays closed with its history unchanged — this ADR documents its follow-up removal, not a re-litigation of the original harness's value at the time it was built.
The Uploader runs as its own process
Narrows: ADR-0005 ("File uploads live in the Bridge, not the shipper"), which is
still true at the pipeline level — uploads are a DC/Bridge concern, not something a log
shipper does — but no longer at the process level: the Uploader was a module and a
worker thread inside dc_bridge; it is now dc_uploader, a separate executable.
Why
Epic #440 (split deployment for fleets) needs the Shipper and the Uploader to run as independently-restartable units so an orchestrator can give each its own lifecycle, resource limits, and credentials. Of the two, the Uploader is the one #440 itself singles out: "I want the upload daemon to crash and restart freely, so that a failing upload never takes down data collection" (user story 18). Inside the Bridge process, that was never true — an unhandled Uploader-thread failure takes the whole Bridge process down with it, Record collection included, because both run in the same address space.
It is also the one piece of this split that does not need to wait for containers. The
Bridge's receives: files subscription, the durable intent queue (#265), and the
Uploader's upload/verify/delete logic (ADR-0005) were already aws-sdk-free at the
library level (dc_bridge_core builds without AWS SDK); only the S3 ObjectStore
implementation and the worker thread's wiring held the Uploader inside the Bridge's
address space. Pulling that into its own OS process is a complete, independently useful
step before #447's container work: unmanaged-shipper mode (#444) needed a second
process to exist on the robot before split deployment made sense; this is that second
process's first independent capability.
Decision
dc_uploaderis a new executable in thedc_bridgecolcon package (not a new ROS package — nothing about it needsament_cmake's ROS-specific machinery beyond reusing the existing build). It linksdc_bridge_core(the same ROS-free librarydc_bridgeitself links) plus the AWS SDK S3ObjectStoreimplementation, and nothing fromrclcpp/rclpy.dc_bridgeno longer links the AWS SDK at all.- Configured entirely by
DC_UPLOADER_*environment variables (dc_bridge/uploader/process_config.hpp), parsed by a pure function (load_uploader_process_config) that is unit-tested against an in-memory map — no ROS parameters, no getenv calls to test around. Queue/state/files directories, object-storage endpoint and credentials, the shipper ingest protocol target, and delete-when-sent/multipart/thumbnail/retention knobs all move here from thefiles.*/uploader.*ROS parameters the Bridge used to read for the Uploader's sake. The Bridge keeps onlyfiles.metadata_destination(it still renders Vector's config and has to know where the Uploader's status Records route) anduploader.data_dir(both processes derive the same queue path from it independently, so a deployment does not need to write the same path out twice). - The Bridge keeps the Files subscription and intent-writing side. A Record on a
receives: filesDestination's topic is parsed, durably enqueued (ADR-0005/#265), and forgotten —dc_uploaderis the only reader. This split exactly where ADR-0005's durable queue already drew its own internal seam; no new coupling was invented; the queue is the interface. IntentQueuegainsrescan(). The queue's on-disk format and single-writer crash-atomicity (#265) were already safe for two processes; what was not is that each process's in-memory scheduling state (oldest-first order, per-entry backoff) was populated once, at construction, from whatever was on disk then. A Bridge process'senqueue()only updates the Bridge's own in-memory view — a separatedc_uploaderprocess holding its ownIntentQueueinstance over the same directory never otherwise learns a new intent exists.rescan()closes that gap: it picks up any*.jsonfile on disk the instance doesn't already know about, without touching already-known entries' backoff state, anddc_uploader's poll loop calls it every cycle (the same ~500ms cadence the worker thread used to pollnext_ready()on).- Still one process tree, one machine.
dc_bringup.launch.pystartsdc_uploaderas a supervisedExecuteProcess(the same patterndc_mcap_writeralready uses, and for the same reason:ros2 rundoes not forward signals to its child), translating thedc_bridge:params block's singlereceives: filesDestination anduploader.data_dir/vector_forward_host/vector_forward_port/files.*into that process's environment. A deployment's params file is unchanged; only the process boundary moved. Runningdc_uploaderas a separate container, with its own volumes and credentials, is #447's work, not this change's.
Consequences
- Killing
dc_uploaderno longer touches Record collection at all — there is no shared address space left for an Uploader failure to take down. Killing it mid-upload loses nothing: the intent that was in flight is still on disk (onlyack()removes it, and that never ran), so the nextdc_uploaderstart replays it fromIntentQueue's existing crash-replay guarantee, unchanged by this ADR. - The ROS container's own credential surface shrinks: object-storage keys live only in
dc_uploader's environment, never in the Bridge's. This is epic #440's user story 5 ("each container receives only the credentials it needs") arriving one process early. - A deployment with no
receives: filesDestination configured starts nodc_uploaderprocess at all —build_uploader_actionreturns no action when the params file names none, matching the Bridge's own "Uploader only exists when Files are configured" behaviour before this change. - Only one
receives: filesDestination per deployment is supported by the environment- variable surface and bydc_bringup.launch.py's translation of it (every params file in this repo already configures at most one). Multiple object-storage endpoints behind onedc_uploaderprocess is out of scope here; it was equally possible and equally untested before this change.
Split deployment topology: the Shipper and the Uploader as separable processes
ADR-0001 put the Shipper on localhost, supervised by DC's bringup, because that was correct for one robot and did not need to be anything else at the time. Epic #440 asks DC to run as a fleet: robots with no internet access, forwarding through an edge Vector aggregator, needing per-component restarts, resource limits, and credentials that a single process tree cannot give. This ADR records where the decomposition line goes and why it stops there.
Decision
The robot decomposes into three processes — the ROS stack (with the Bridge), the Shipper, and the Uploader — and no further. Whether those three run as one process tree (ADR-0001's original native mode), three containers on one machine (#447), or spread across robot, edge, and hub tiers (#440's target architecture) is a deployment-time choice, not a code change: the Bridge's unmanaged-shipper mode (#444) and the Uploader's extraction into its own process (ADR-0014) are what let the same binaries run in every shape.
Why the decomposition stops at the Shipper and the Uploader, and does not extend to ROS nodes. DDS is the wrong protocol to run over anything but a robot's own local network — it assumes multicast discovery and low-latency links that neither an edge tunnel nor a security-conscious deployment can offer (epic #440's user stories 21/22: DDS stays on the robot, no inbound connection reaches it). The Shipper and the Uploader are the two components that already speak something else — the shipper ingest protocol and a plain object-storage API, respectively — so they are the only components that can cross a process, container, or host boundary without inventing a new transport for the purpose. Every ROS node, including the Bridge, stays together in one container on one machine per robot.
Rejected alternative: routing File bytes through the Shipper or a database
Considered and rejected: instead of the Uploader talking to object storage directly, put File bytes on the same path as Records — base64 them into a Record field, or write them into a database column. Rejected because:
- Base64 inflates payload size by roughly a third, for images and videos that are already the largest artifacts DC moves.
- Multi-megabyte Records force the Shipper's buffer, and any relational Destination's row storage (PostgreSQL TOAST), to handle a size class neither is designed for — at the cost of every other Record sharing that same path.
- On a fleet robot's constrained uplink, the bytes would cross the network twice: once to the Destination, and once because neither the Shipper nor a database offers a way to skip re-sending a field that already made it through.
DC keeps the claim-check pattern instead (ADR-0005): the Record carries a reference, the Uploader moves the bytes out of band.
Consequences
- Managed mode (one supervised process tree, ADR-0001's original design) and unmanaged mode (#444, this ADR) are both first-class; native install and simulation do not need containers to stay correct.
- The Shipper's own buffer and the Bridge's upload intent queue are separate volumes with separate owners — a container boundary makes visible, as two mount points, what was already two independent pieces of on-disk state internally.
compose.split.yaml(#447) is the concrete rendering of this decision for one machine; Podman Quadlet and Kubernetes manifests for the fleet tiers describe the same topology differently, not a different decision.- ADR-0001 is amended alongside this ADR: "runs on localhost, supervised by DC's bringup" is no longer true of every deployment.
Helm chart for the robot tier, Kustomize overlays per site/robot
deploy/robot/ (#450) renders the robot tier's fixed topology three ways (Compose,
Quadlet, Kubernetes) — one shape, identical on every run. tools/kind/ (#452) faced the
same question for its CI harness and rejected Helm there: that harness deploys one fixed
topology every run, nothing to parameterize, so a chart would template a variance that
doesn't exist (tools/kind/README.md's "Why not Helm"). That reasoning does not carry
over to deploy/robot/'s actual deployable manifests: a fleet's robots genuinely differ
— edge aggregator address, robot identity, resource limits, image tags, credentials — and
kubernetes/robot-pod.yaml has no way to express that difference except hand-editing a
copy per site, the same problem tools/kind/kubernetes/robot-a.yaml already shows in
miniature (a second, hand-forked copy of the base Pod for one test site).
Decision
Two tools, two different jobs, composed in one command:
- Helm owns the values surface: whatever genuinely varies per deployment and is
worth typing, defaulting, and validating as a named field — robot identity
(
robot.name), image repository/tag per container, per-container resource requests/limits, the edge aggregator's address (edge.vectorHost/vectorPort), and the Uploader's S3 credentials/endpoint.deploy/robot/helm/dc-robot/is this chart. Its defaults reproducekubernetes/robot-pod.yaml+params/robot_params.yamlfield for field (verified:helm templatewith no overrides passes the samekubeconformcheck that file does) — the chart is a parameterized version of the existing reference, not a new design, and that file remains the runtime-free/k3d/kind reference it already was. - Kustomize owns what a chart's values don't, and shouldn't, cover: per-site
placement and cluster-specific concerns that have nothing to do with the
application's own configuration — which namespace a site's release lands in, which
node it's scheduled to, any raw patch a site needs that doesn't rise to the level of
a chart value.
deploy/robot/helm/overlays/site-a/is the reference overlay: it setsnamespace: dc-robot-site-a, suppliesvalues-site-a.yaml(robot identity + edge address — the chart's own surface), and patches in anodeSelectorpinning the Pod to that site's labeled edge-adjacent node — deliberately not a chart value, because which node a robot lands on is a per-cluster scheduling fact the chart has no business knowing about.
The two compose through kustomize's native Helm chart inflator (helmGlobals.chartHome +
helmCharts:, --enable-helm), not a two-step helm template | kubectl apply -k -
pipeline: one command (kubectl kustomize --enable-helm --load-restrictor LoadRestrictionsNone deploy/robot/helm/overlays/site-a) renders the chart and applies
the overlay's namespace/patches to the result, matching the single-command shape
deploy/robot/k3d/kustomization.yaml already established for piping kubectl kustomize
into kubectl apply -f -. --load-restrictor LoadRestrictionsNone is required for the
same reason it already is there: the overlay's base (the chart, via chartHome: ../..)
lives outside the overlay's own directory tree.
A site with N robots installs N releases — one per robot, each with its own
values-<robot>.yaml and, where needed, its own overlay directory — never one release
templating N robots internally; robot.name (and, by convention, the release's
namespace) is the per-robot identity, matching how tools/kind/kubernetes/robot-a.yaml
already names one Pod per test site rather than templating a list.
Rejected alternatives
Kustomize alone, patching kubernetes/robot-pod.yaml per site (no Helm). This is
what tools/kind/ already does, correctly, for its own one-fixed-topology problem.
deploy/robot/'s real fleet has a values surface shared and validated the same way
across every site — image tags bumped in one place per release, resource limits typed
as actual Kubernetes resources stanzas, credentials with a documented shape — that
raw per-site strategic-merge patches would reduplicate at every overlay instead of
declaring once. Kustomize's own patches are the right tool for one-off, structural
differences (a nodeSelector, an extra label); they are the wrong tool for a values
contract every site fills in.
Helm alone, one values-<site>.yaml per site, no Kustomize. Considered, since Helm
values could technically carry a nodeSelector or namespace override too. Rejected
because it pushes every future site-specific concern into the chart's own values schema
regardless of whether it belongs there, growing values.yaml into a dumping ground and
coupling unrelated cluster-placement changes to chart version bumps. Kustomize overlays
keep that class of change scoped to the site's own directory, reviewable independently
of the chart.
Per-site values vendored as Helm subcharts or an umbrella chart. Rejected: it
couples a site's own inventory (and, worse, tempts committing its credentials) into the
chart's own repository structure. Overlay directories under helm/overlays/ keep
site inventory as plain files a site's own GitOps tooling can manage independently of
chart releases, with credentials passed via an uncommitted -f/--set file rather than
living in the chart.
Consequences
- Additive only:
compose.yamlandquadlet/*.containerare untouched, andkubernetes/robot-pod.yamlremains the runtime-free/k3d/kind reference — this ADR adds a parameterized rendering path for real Kubernetes deployments, not a replacement of any of the three. deploy/robot/helm/dc-robot/templates/configmap-robot-params.yamlreplacesrobot-pod.yaml'shostPathmount forrobot_params.yamlwith a ConfigMap — the real-cluster mechanism that file's own header already called for ("a Pod-scoped Secret/ConfigMap object is the real-cluster mechanism ... kustomize or a site's own GitOps tool").robot-pod.yamlitself keeps thehostPath, since that is what makespodman kube play/k3d/kind runnable with no cluster-side object to create first.- Values that hold real credentials (
uploader.s3.accessKeyId/secretAccessKey) ship with the same literal placeholdersparams/robot_params.yaml/robot-pod.yamlalready use ("changeme"), for the same reason: runnable as shipped, not a design invitation to commit real ones — a real deployment overrides them from an uncommitted values file, never a committed one. tools/kind/README.md's "Why not Helm" stays correct for that harness: it is a different problem (one fixed topology, nothing to parameterize) from the one this ADR answers.
Future work and Roadmap
DC still being in early development, it requires:
- High test coverage
- More Measurement plugins
- More blessed Destination types, promoted from the passthrough as usage justifies it
- Guide for the Backend developer: I would like DC to be simple enough so a web developer can run it, get the data and work on its backend application
- Guide for the ROS developer: I would like DC to be simple enough so a ROS developer can collect data without the expertise of knowing how to manage databases
- More use cases showcased in demos
Participating
TLDR
| Event | What to do |
|---|---|
| Want to contribute | Open a PR |
| Found a bug | File a ticket on Github Issues |
| Found a vulnerability | Report it privately |
| Feature request | Describe what you want on Github Discussions |
| Want to start a discussion | Start one on Github Discussions |
| Be aware of the ongoing development | Take a look at the Github Project and what is being worked on |
Contributing
Feature requests
Since I want DC to be community driven, go to Github discussions, start a discussion about a features you want to see and users will be able to vote for your it. Most requested features will have more attention than others.
Found a bug?
If you find a problem, first search if an issue already exists. If a related issue doesn't exist, you can open a new issue using the issue form.
Found a vulnerability?
Do not open a public issue, discussion or pull request. Report it through GitHub private vulnerability reporting instead; the security policy states the supported branches, the response targets and what is in scope.
General guidelines
You can contribute to the source code with Pull Requests, for example:
- To fix a typo you found on the documentation.
- To propose new documentation sections.
- To fix an existing issue/bug.
- Make sure to add tests.
- To add a new feature.
- Make sure to add tests.
- Make sure to add documentation if it's relevant.
Branches and backports
Development happens on rolling, the repository's default branch: open every PR against
rolling. One branch per ROS 2 distro keeps the release lines:
| Branch | Role |
|---|---|
rolling | development tip — all new work lands here first |
jazzy | ROS 2 Jazzy line, receives rolling backports until its EOL (05/2029) |
lyrical | ROS 2 Lyrical line, receives rolling backports until its EOL (05/2031) |
humble | legacy line (DC 1.x, embedded Fluent Bit), maintained on its own branch, no backports |
To have a merged change land on a distro branch too, label the PR backport:jazzy and/or
backport:lyrical before merging. Small mechanical fixes port cleanly; restructuring
changes usually don't — keep those rolling-only. When the PR merges, the Backport workflow
cherry-picks the PR's commits onto each labeled branch and opens a PR there, linking back
to the original. A cherry-pick that conflicts still opens a PR, with the conflict markers
left in the files and the conflicting files listed in the PR body: resolve them there.
Backport PRs created by the workflow don't start CI on their own — GitHub doesn't run workflows for PRs created with the workflow's own token. Close and reopen one to trigger its checks.
Preview what a merge would backport, creating nothing:
./tools/ci/backport.sh <pr-number> --dry-run
# or the same plan through the workflow:
gh workflow run backport.yml -f pr_number=<pr-number>
Setup environment
ROS
Follow the steps to build your workspace and install dependencies in the setup section
Then install the git hook. .pre-commit-config.yaml is run by
prek, a single-binary reimplementation of pre-commit:
uv tool install prek # or: curl -LsSf https://prek.j178.dev/install.sh | sh
prek install
You are now ready to write some code, commit and follow the standards with the git hook. To run every hook over the whole tree the way CI does:
prek run --all-files --skip build-doc # drop the --skip to check the docs build too
License headers
The repo follows REUSE: every file declares its copyright and
license, and the reuse hook fails if one doesn't. Sources say so in a header:
// SPDX-FileCopyrightText: 2022-2026 David Bensoussan
// SPDX-License-Identifier: MPL-2.0
reuse annotate writes it for you, in whatever comment syntax the file uses:
uvx reuse annotate --copyright "2022-2026 David Bensoussan" --license MPL-2.0 path/to/new_file.cpp
uvx reuse lint # what the hook runs
Files that can't carry a comment — images, meshes, fonts — are covered by path in
REUSE.toml, which is also where third-party assets declare their own upstream license.
Add a new license there and run uvx reuse download --all to fetch its text into
LICENSES/.
Docs
The doc toolchain (mdbook plus its preprocessors — mdbook-admonish, mdbook-mermaid,
mdbook-open-on-gh — and mdbook-linkcheck, all pinned) runs inside a Podman image built
from containers/doc/Containerfile; mdbook's preprocessor ABI isn't stable across minor
versions, so an unpinned cargo install mdbook can silently pull an incompatible set. The
same two scripts CI, the build-doc pre-commit hook, and a local editing loop all use:
./tools/ci/pre-commit/build_doc.sh # one-shot build -> doc/book/html
./tools/ci/pre-commit/serve_doc.sh # live-reloading dev server at http://127.0.0.1:3000
Open the doc folder of the repository and edit the Markdown files you need — serve_doc.sh
reloads the browser on every save. Editing an ADR under docs/adr/ needs one re-run of
tools/ci/pre-commit/generate_adr_pages.py first, since that's what mirrors it into
doc/src/dc/adr/.
Declaring plugin parameters
Measurement and Condition plugins (dc_measurements/plugins/{measurements,conditions}/)
declare their own parameters in onConfigure(). Always do this through
dc_util::get_*_type_param() (dc_util/include/dc_util/node_utils.hpp) — never call
declare_parameter or nav2_util::declare_parameter_if_not_declared directly. One call
both declares and reads the value, and exits with a clear RCLCPP_FATAL if it can't be
retrieved, instead of a hand-rolled declare/get/try-catch block per parameter:
// Mandatory (no default; fatal if not overridden):
cam_name_ = dc_util::get_str_type_param(node, measurement_name_, "cam_name");
// Optional, with a default:
polling_interval_ = dc_util::get_int_type_param(node, measurement_name_, "polling_interval", 1000);
plugin_name/measurement_name_/condition_name_ is the namespace prefix — the helper
declares and reads "<plugin_name>.<param_name>". Available types: str, str_array,
bool, bool_array (mandatory only), int, int_array (mandatory only), double,
double_array (mandatory only). measurement_server.cpp/group_server.py-level
parameters that have no plugin namespace use the equivalent dc_util::get_str_param() /
get_str_array_param() (no plugin_name argument).
This single-source-of-truth convention is deliberate: see
ADR-0008
for why nav2_util stays a dependency and dc_util wraps it rather than replacing it.
dc_group (Python) has no plugins and no equivalent wrapper — group_server.py declares
each of its parameters exactly once via plain self.declare_parameter(...), which is
sufficient there (see the ADR).
Tests
TODO...
FAQ
I can't find a Measurement I need
Measurements will keep being added, but the current focus is on getting feedback, fixing bugs, documentation and reaching a minimum test coverage.
Create a feature request in Github Discussions...or better, write your plugin and open a Pull Request.
I can't find the Destination I need
You do not need one to exist. The blessed Destination types are the ones DC configures natively from ROS parameters; everything else in Vector's catalog works today through the passthrough — see the question below.
How can I send data to a Destination that isn't blessed?
The Bridge (dc_bridge) renders its Shipper's (Vector) config from plain ROS
parameters for a blessed set of receives: records Destination types only (local
file, another Vector Shipper — see Destinations; S3-compatible
storage is also blessed, but only for receives: files File uploads). Every other sink
in Vector's catalog — including
PostgreSQL, S3-compatible storage for Records, console, and third-party sinks like Kafka,
Kinesis, InfluxDB, webhooks, … — is reachable through the passthrough: list a raw
Vector config snippet (TOML) in the custom_config_files parameter, and consume the
public dc.<tag> route it needs. No DC code, plugin, or extra language required — only
Vector configuration.
Can a passthrough snippet be generated or written in a language other than TOML?
The snippet the Bridge merges in must be Vector's own TOML configuration syntax — DC does not transform it. If you would rather generate that TOML from another language or tool, nothing stops you from doing so as a build or deploy step; the Bridge only reads the resulting file.
My group data is not published on the group topic
This may happen for different reasons:
- The group node is not started, be sure it is (ros2 node list), you will need to enable it in your launch file or using the
group_node:=truewhen launching the bringup - Data is not being published on all topics it subscribes to (use
ros2 topic echoon each to ensure that). A Group waits for every one of itsinputs, so one silent Measurement keeps the whole Group silent. Set the group'ssync_timeoutandon_sync_timeout: "emit_partial"to publish a partial Record with whatever did arrive instead — see Groups → Incomplete sets.message_filtershas no timeout of its own (see this discussion), so DC runs a deadline timer alongside the synchroniser to do this.
About and Contact
About
DC is maintained by:

David Bensoussan
Contact
Pick the channel that fits:
d.bensoussan@proton.me for private inquiries, configuration support and private feature development.
GitHub Issues for bugs and open-source feature requests.
GitHub Discussions for questions and usage help.