Grafana
Description
Grafana is a multi-platform open source analytics and interactive visualization web application. It provides charts, graphs, and alerts for the web when connected to supported data sources.
Start in a container
Execute:
./tools/infrastructure/scripts/install_infrastructure.bash \
  --tool=grafana \
  --install-type=docker
Start natively
./tools/infrastructure/scripts/install_infrastructure.bash \
  --tool=grafana \
  --install-type=native
What comes up with it
Datasource and dashboards are provisioned from
tools/infrastructure/docker/config/grafana/ — no manual import. The PostgreSQL datasource
(uid dc_postgres) points at the PostgreSQL container, and four
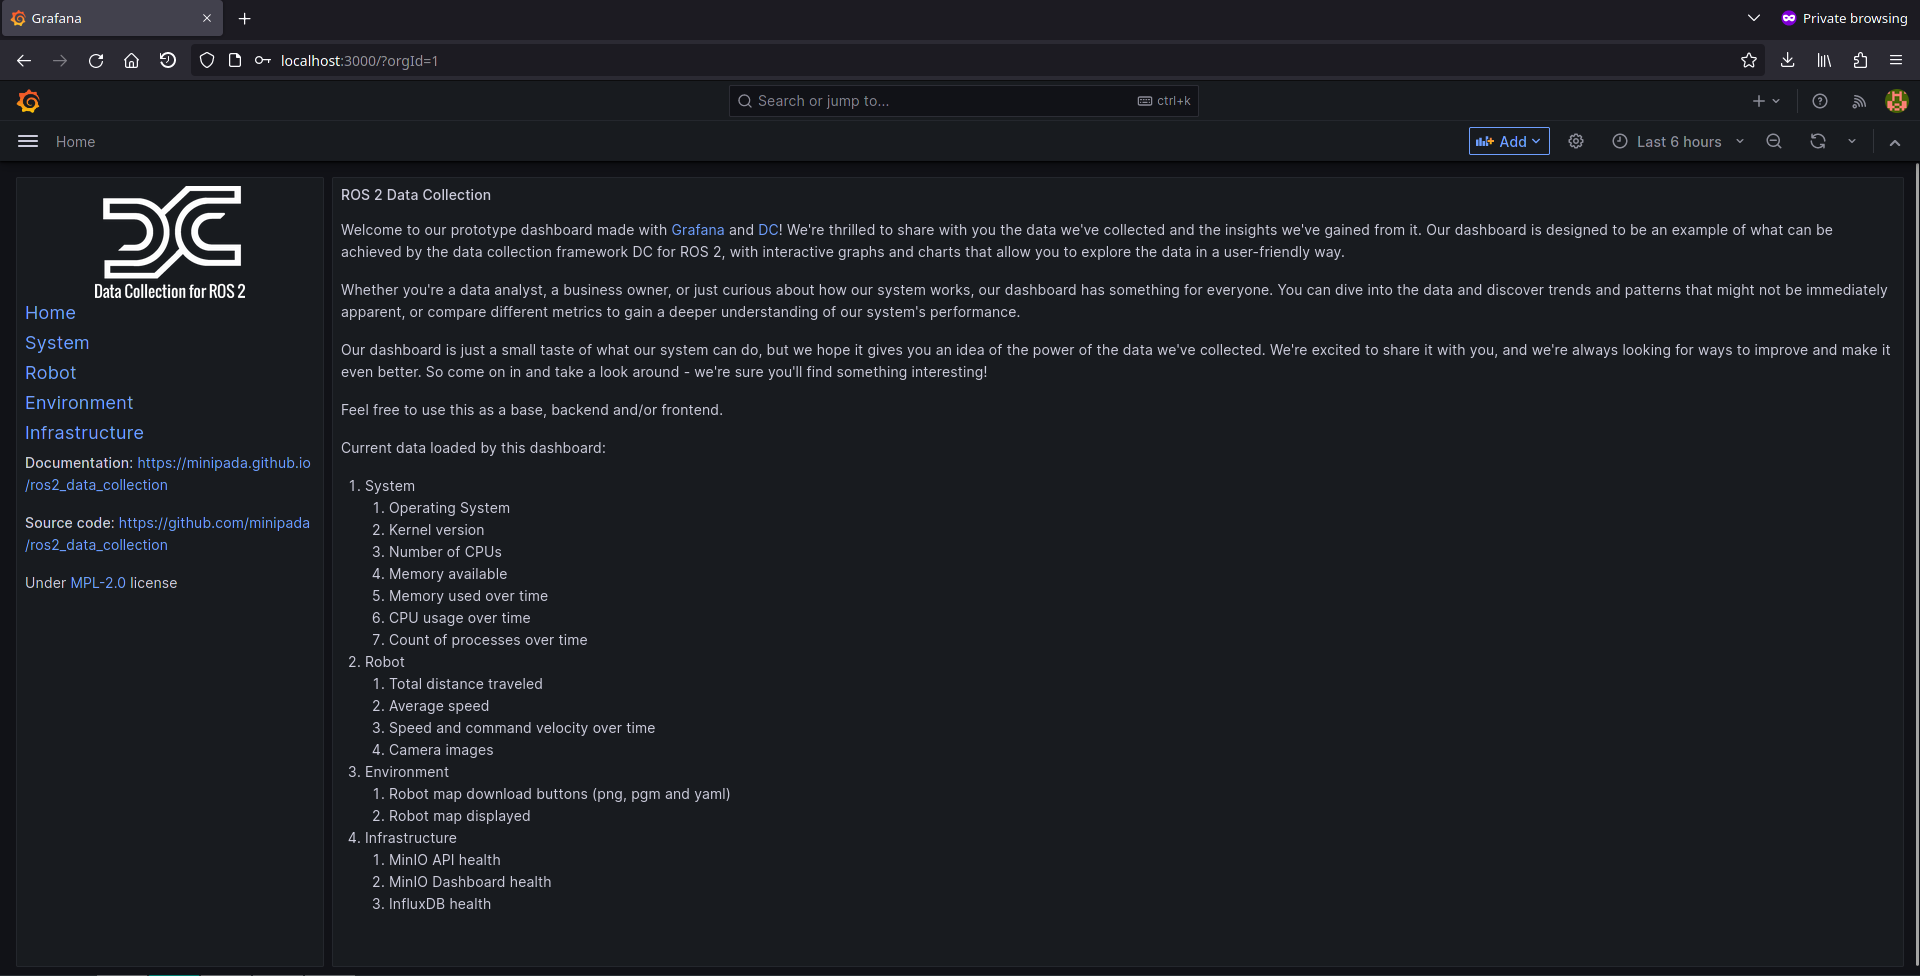
dashboards ship: Home, Robot, KPI (availability and uptime, backed by the
KPI views), and Fast DDS statistics.
Credentials
| User | Password | Port |
|---|---|---|
| admin | admin | 3000 |
How to use
Open http://localhost:3000 and log in; the provisioned dashboards are under Dashboards: